Fig. 4.
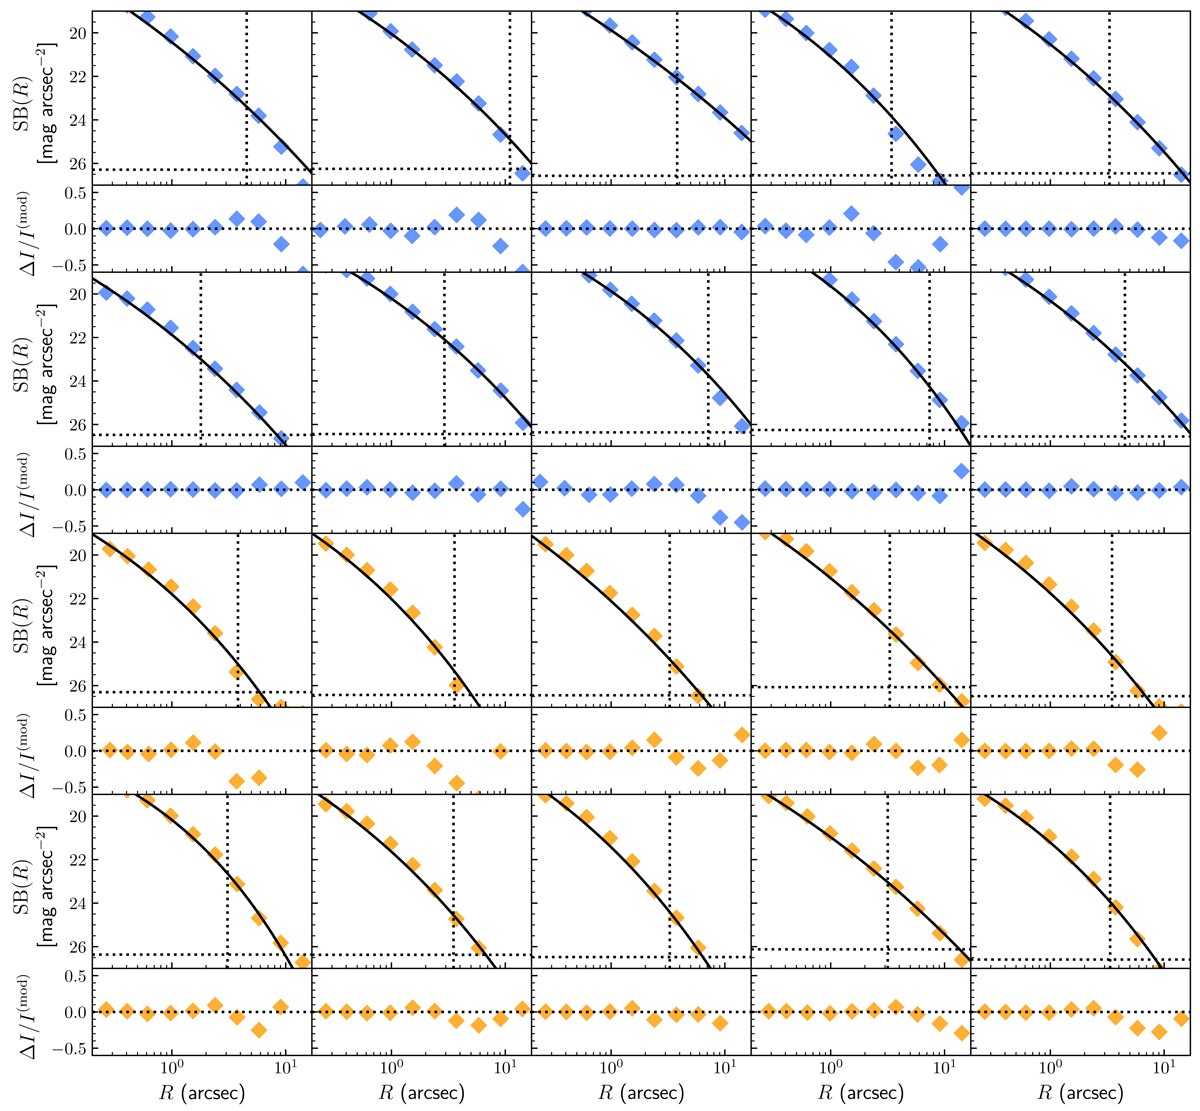
Surface brightness profiles in i-band of the twenty galaxies shown in Fig. 1. Top: observed surface brightness, azimuthally averaged in radial bins (blue diamonds) and best-fit Sérsic model (black solid curve), as a function of circularised radius. Bottom: residuals between observed and model flux, divided by the model flux. The two different colours correspond to SDSS and GAMA galaxies, as in Fig. 2.
Current usage metrics show cumulative count of Article Views (full-text article views including HTML views, PDF and ePub downloads, according to the available data) and Abstracts Views on Vision4Press platform.
Data correspond to usage on the plateform after 2015. The current usage metrics is available 48-96 hours after online publication and is updated daily on week days.
Initial download of the metrics may take a while.