Free Access
Fig. 11.
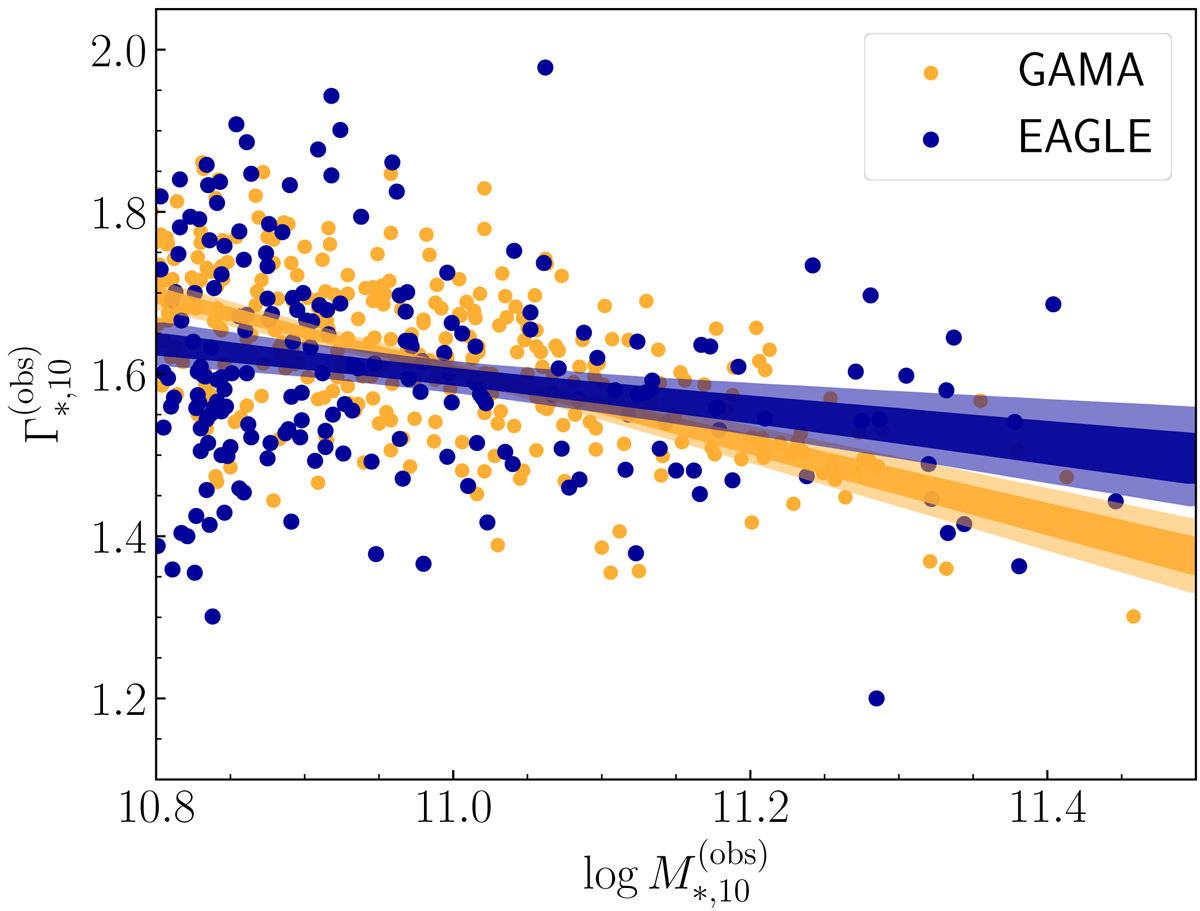
Relation between M*,10 and Γ*,10 of a volume limited sub-sample of GAMA galaxies, and of similarly selected galaxies from the EAGLE simulation. The bands show the 68% and 95% credible regions of the M*,10 − Γ*,10 relation obtained by fitting the model of Eq. (9) to each sample.
Current usage metrics show cumulative count of Article Views (full-text article views including HTML views, PDF and ePub downloads, according to the available data) and Abstracts Views on Vision4Press platform.
Data correspond to usage on the plateform after 2015. The current usage metrics is available 48-96 hours after online publication and is updated daily on week days.
Initial download of the metrics may take a while.