Fig. 6.
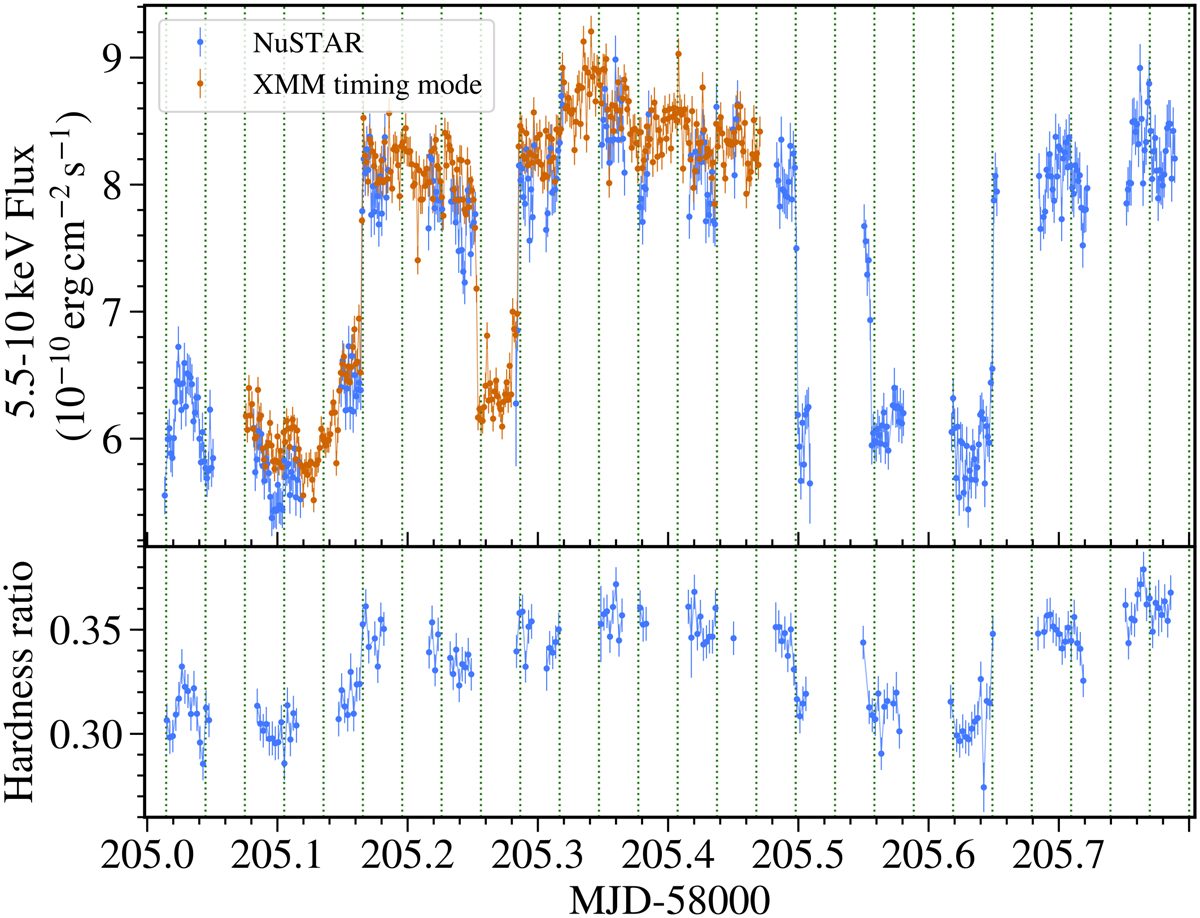
Light curves and hardness ratio of the NuSTAR and XMM-Newton observations of the late flip-flops. We used the same energy ranges and time bins as in Fig. 4. The Burst mode is not included here, as it was strongly affected by soft proton flares. Vertical lines are drawn every 2610 s, showcasing that the late flip-flops also feature a period underlying the times of transition between the two flip-flop states.
Current usage metrics show cumulative count of Article Views (full-text article views including HTML views, PDF and ePub downloads, according to the available data) and Abstracts Views on Vision4Press platform.
Data correspond to usage on the plateform after 2015. The current usage metrics is available 48-96 hours after online publication and is updated daily on week days.
Initial download of the metrics may take a while.