Fig. 4.
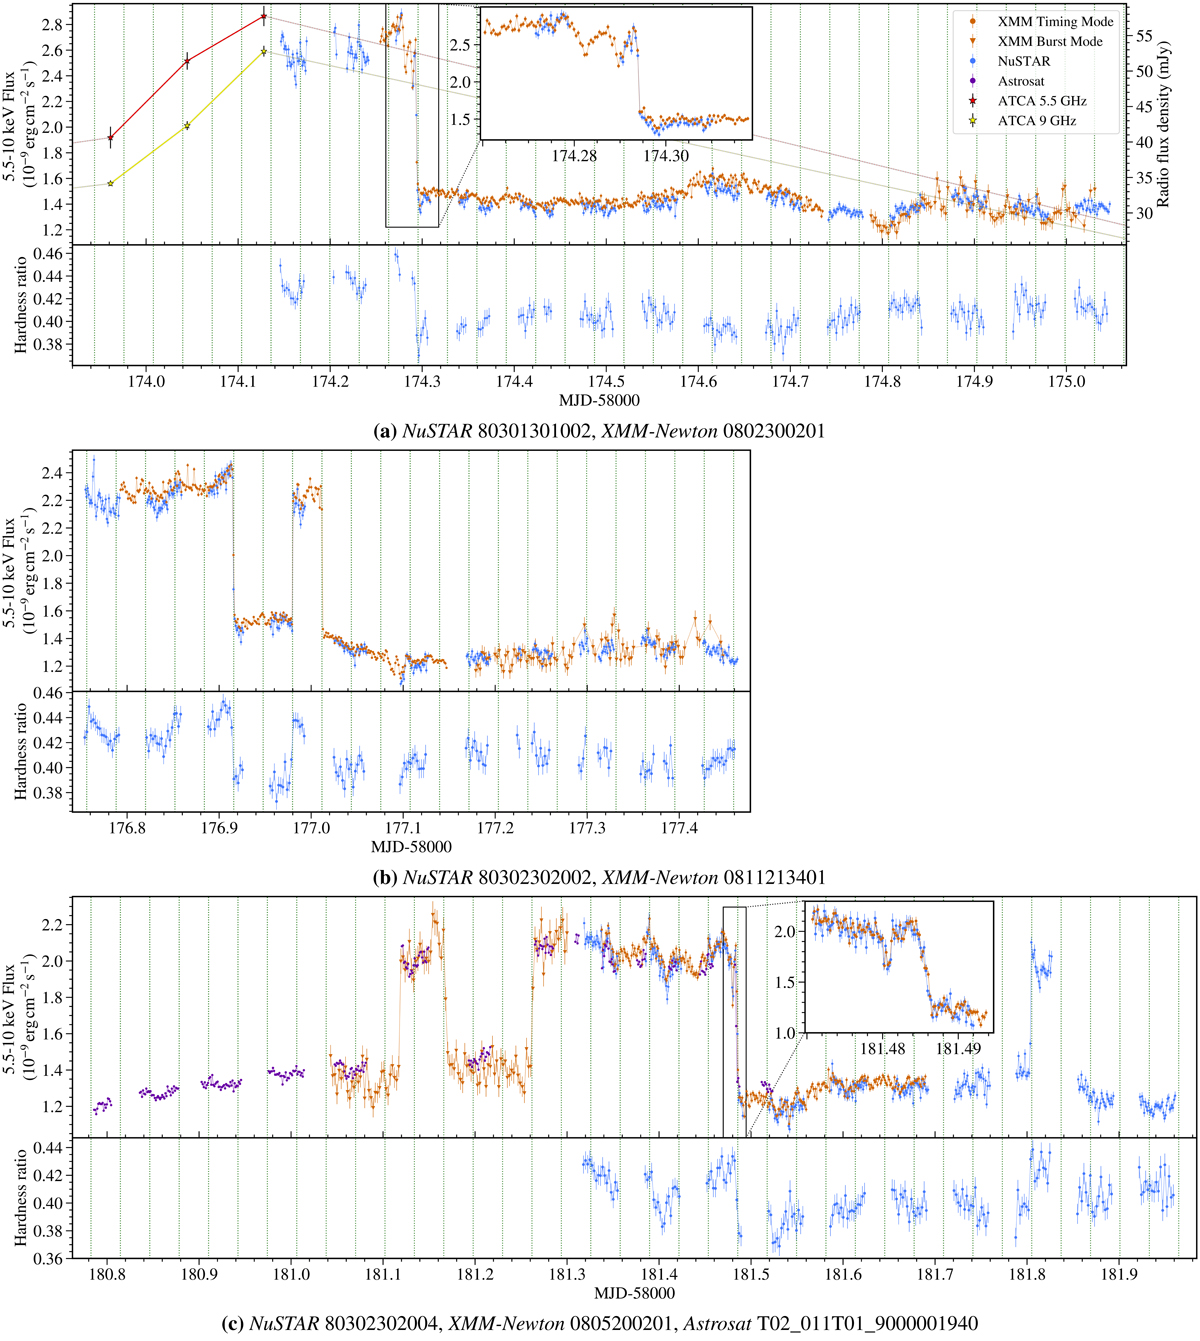
Light curves and hardness ratios of all NuSTAR, XMM-Newton, and Astrosat observations containing flip-flops. The NuSTAR and XMM-Newton light curves are shown for the energy range 5.5–10 keV in all cases. Astrosat count rates are rescaled to the fluxes observed in the other instruments. The hardness ratios are computed as the ratio of counts in the two energy bands 8–79 keV, and 3–8 keV for the NuSTAR observations only. (a) (b) and (c) mark the three almost continuous long observations of the source within the early flip-flop interval. The light curves are binned into 100 s intervals, except for the two insets, which have time bins of 40 s, and 20 s, respectively. The hardness ratios are determined for 200 s bins. Vertical lines are plotted every 2761 s, showing that almost all flip-flop transitions occur at integer multiples of a fundamental period. This is discussed in more detail in Sect. 5.
Current usage metrics show cumulative count of Article Views (full-text article views including HTML views, PDF and ePub downloads, according to the available data) and Abstracts Views on Vision4Press platform.
Data correspond to usage on the plateform after 2015. The current usage metrics is available 48-96 hours after online publication and is updated daily on week days.
Initial download of the metrics may take a while.