Fig. 22.
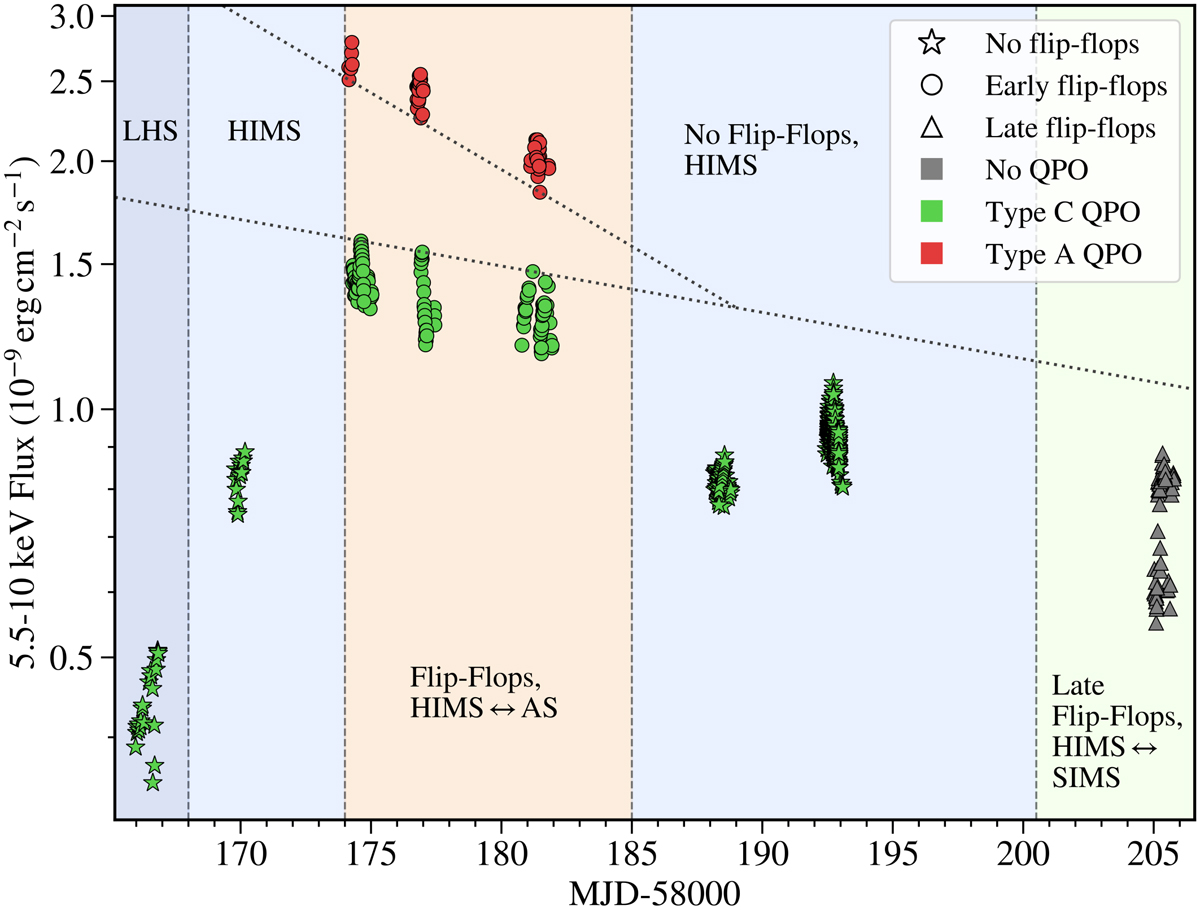
Swift J1658.2-4242 light curve, with flux plotted on a logarithmic scale, analogous to Fig. 14 of C04. We also plotted exponentials describing the minimum type A flux, and the maximum type C flux, as a function of time. We only included NuSTAR, and XMM-Newton data, as their spectra enable an accurate flux determination, and as the QPO type can be unambiguously identified from their light curves. We removed data points during transitions between the two states to show the limiting fluxes of each state when there is no transition.
Current usage metrics show cumulative count of Article Views (full-text article views including HTML views, PDF and ePub downloads, according to the available data) and Abstracts Views on Vision4Press platform.
Data correspond to usage on the plateform after 2015. The current usage metrics is available 48-96 hours after online publication and is updated daily on week days.
Initial download of the metrics may take a while.