Fig. 21.
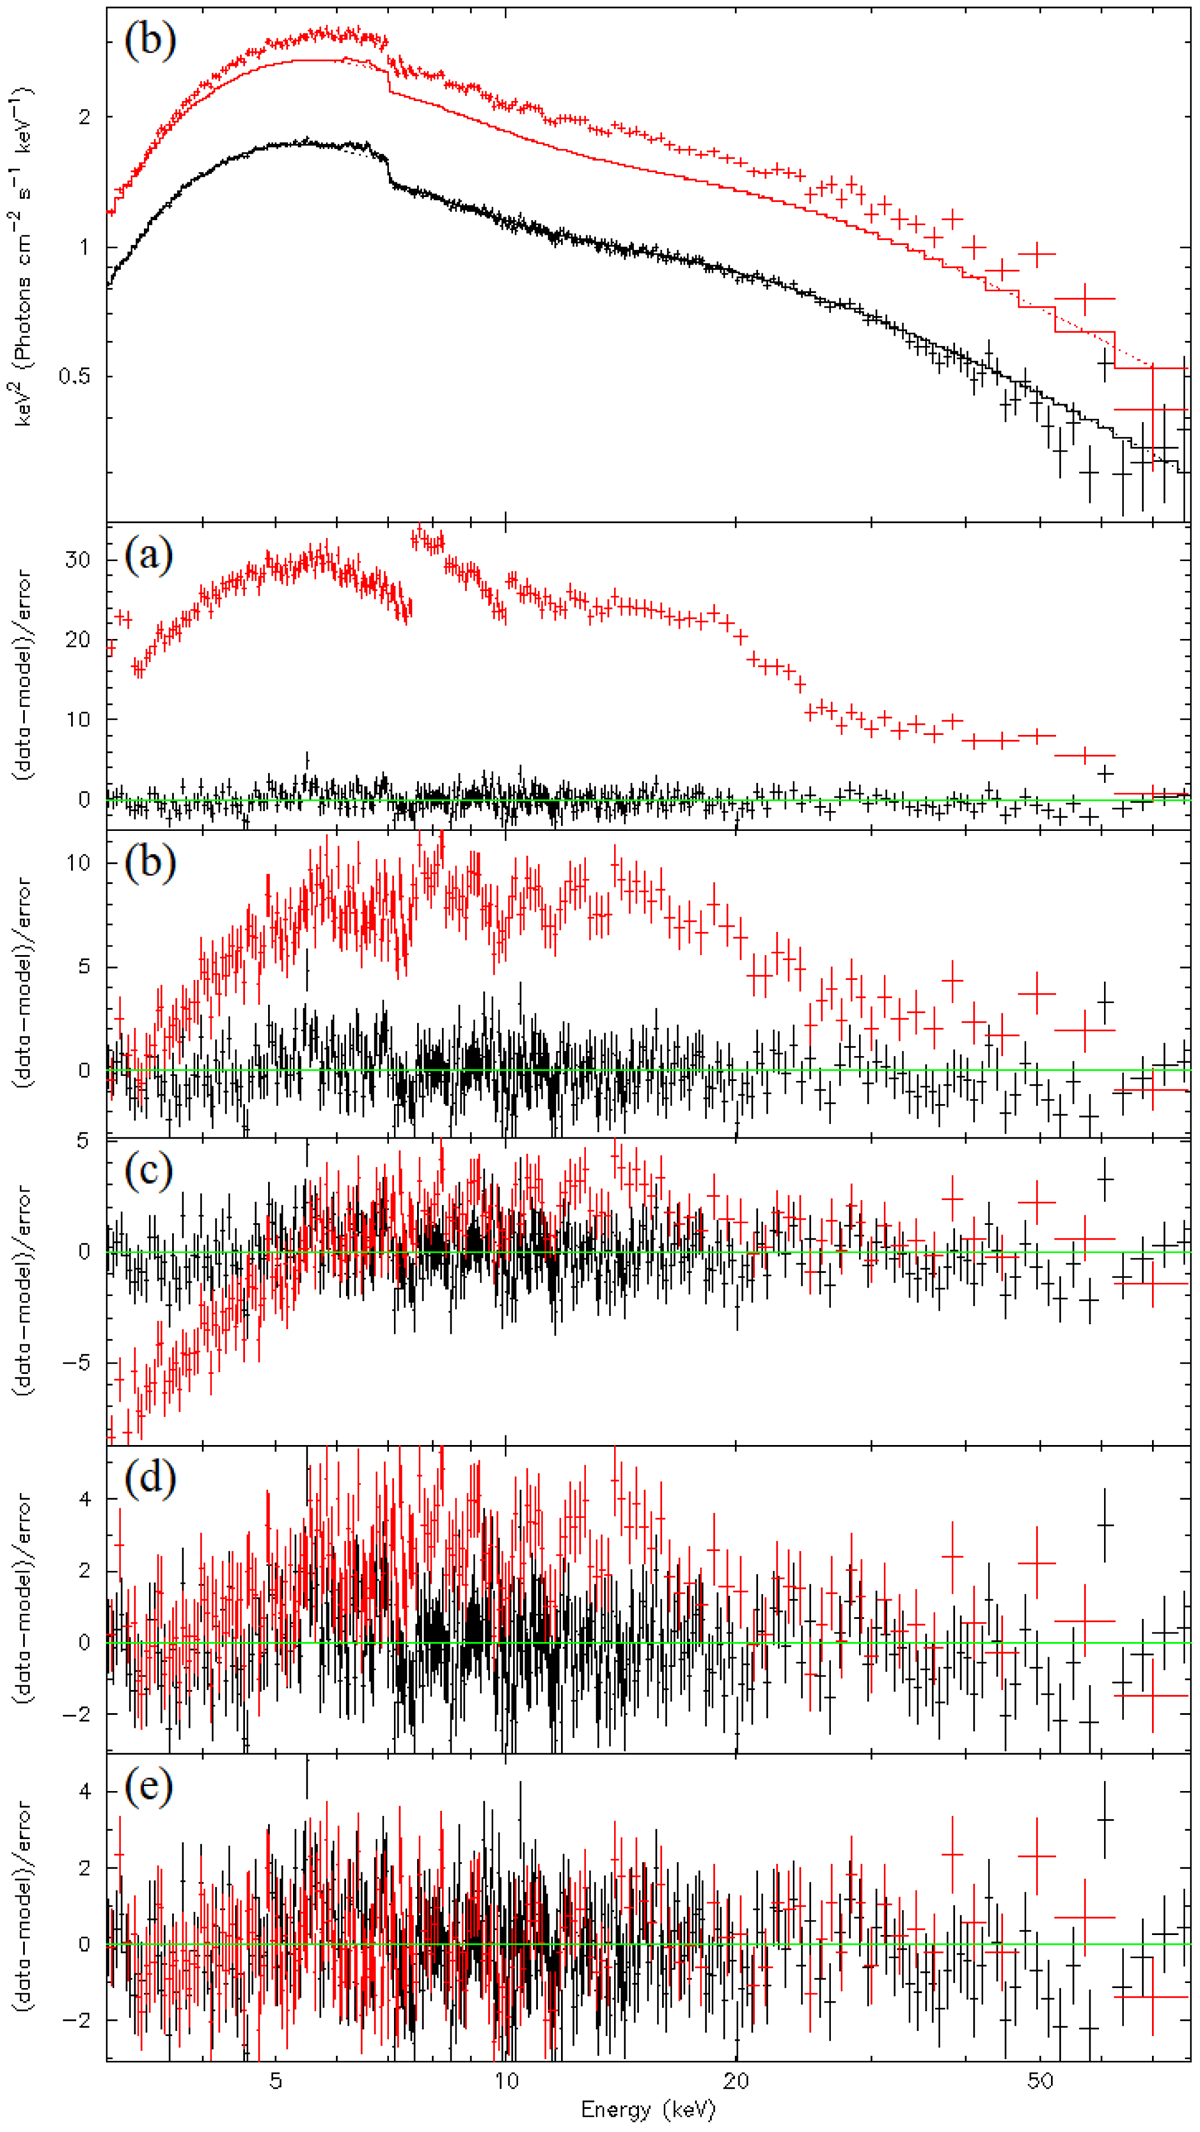
Comparison of the bright (red) and dim (black) flip-flop spectra fitted with Model 2, with the spectral parameters initially set to the best fit values of the dim state (a). By setting the inner disc temperature of the bright flip-flop spectral fit to its best fit value, we obtain fit (b) and close most of the gap between the two spectra. In plot (c) we additionally modify the compPS normalisation of the bright state spectrum to its best fitting value. Most of the remaining difference between the two spectra is corrected for by the change in NH (d). Finally, in plot (e) we show the residuals of the best fits to both bright and dim spectra, with completely independent parameters.
Current usage metrics show cumulative count of Article Views (full-text article views including HTML views, PDF and ePub downloads, according to the available data) and Abstracts Views on Vision4Press platform.
Data correspond to usage on the plateform after 2015. The current usage metrics is available 48-96 hours after online publication and is updated daily on week days.
Initial download of the metrics may take a while.