Fig. 2.
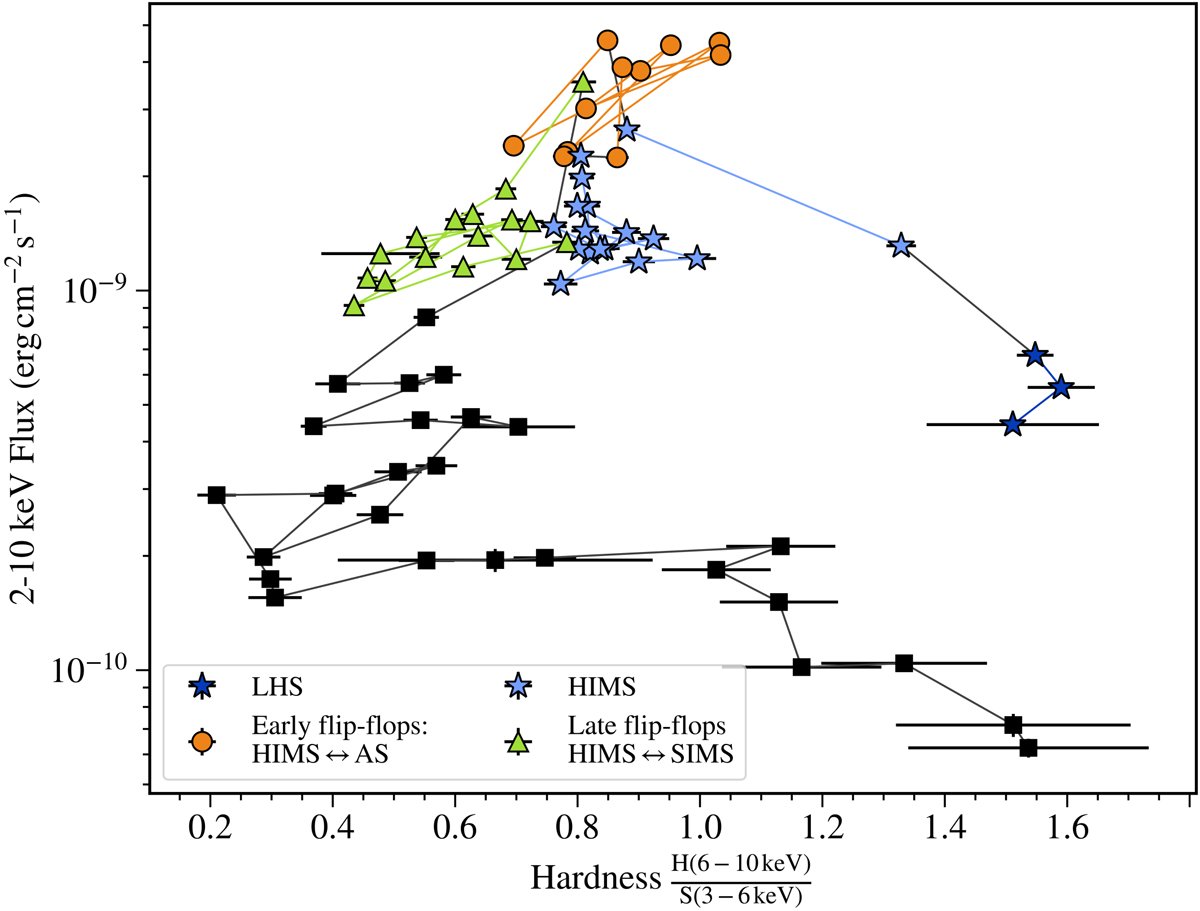
HID of all Swift/XRT observations. Colours and shapes distinguish the different states of the outburst. Hardness is defined here as the ratio of fluxes in the two energy bands 6–10 keV, and 3–6 keV. Each data point represents one entire observation. Black squares are observations for which a state classification was not possible. The errors in the flux are shown but are almost always smaller than the symbols used for the data points.
Current usage metrics show cumulative count of Article Views (full-text article views including HTML views, PDF and ePub downloads, according to the available data) and Abstracts Views on Vision4Press platform.
Data correspond to usage on the plateform after 2015. The current usage metrics is available 48-96 hours after online publication and is updated daily on week days.
Initial download of the metrics may take a while.