Fig. 19.
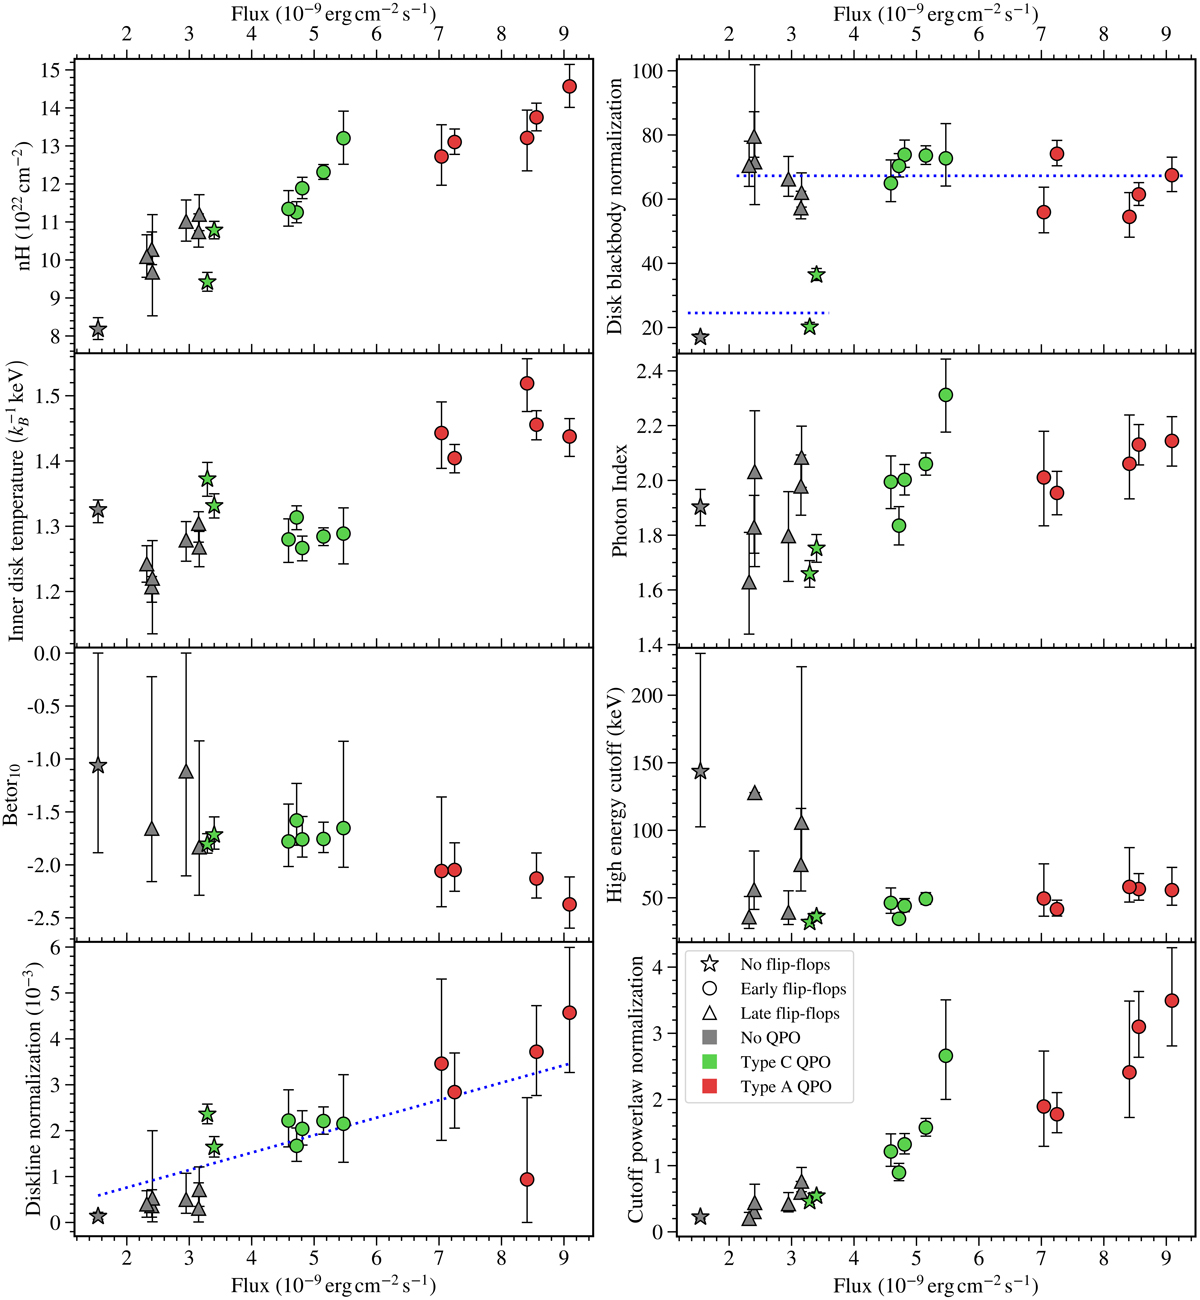
Comparison of the best fit NuSTAR spectral parameters of individual observations and flip-flop states fitted with Model 1, dscor*tbabs*constant*(diskline+diskbb+cutoffpl). The spectra are distinguished by their corresponding fluxes, timing properties, and their flip-flop state classifications. The first NuSTAR observation has been excluded, as its spectrum had a negligible black body component, and therefore differed too greatly from the spectra shown here. The blue dashed line in the graph of diskline normalisation as a function of flux, depicts a line of constant equivalent width, assuming no change in spectral shape at an energy of 6.4 keV. This is a reasonably good assumption, as is demonstrated by Fig. 18. The two blue dashed lines in the diskbb normalisation graph indicate the average values of this parameter for flip-flop and non-flip-flop spectra. One dim flip-flop observation featuring a type C QPO has been omitted from the graph of the high energy cutoff for display clarity, as this parameter was not well constrained in the spectral fit of this particular observation, having a best fit of ![]() . We also excluded one bright state, and three late flip-flop data points from the graph of Betor10, as the fits were insensitive to this parameter, and the errors in the measurements could not be determined.
. We also excluded one bright state, and three late flip-flop data points from the graph of Betor10, as the fits were insensitive to this parameter, and the errors in the measurements could not be determined.
Current usage metrics show cumulative count of Article Views (full-text article views including HTML views, PDF and ePub downloads, according to the available data) and Abstracts Views on Vision4Press platform.
Data correspond to usage on the plateform after 2015. The current usage metrics is available 48-96 hours after online publication and is updated daily on week days.
Initial download of the metrics may take a while.