Open Access
Fig. 17.
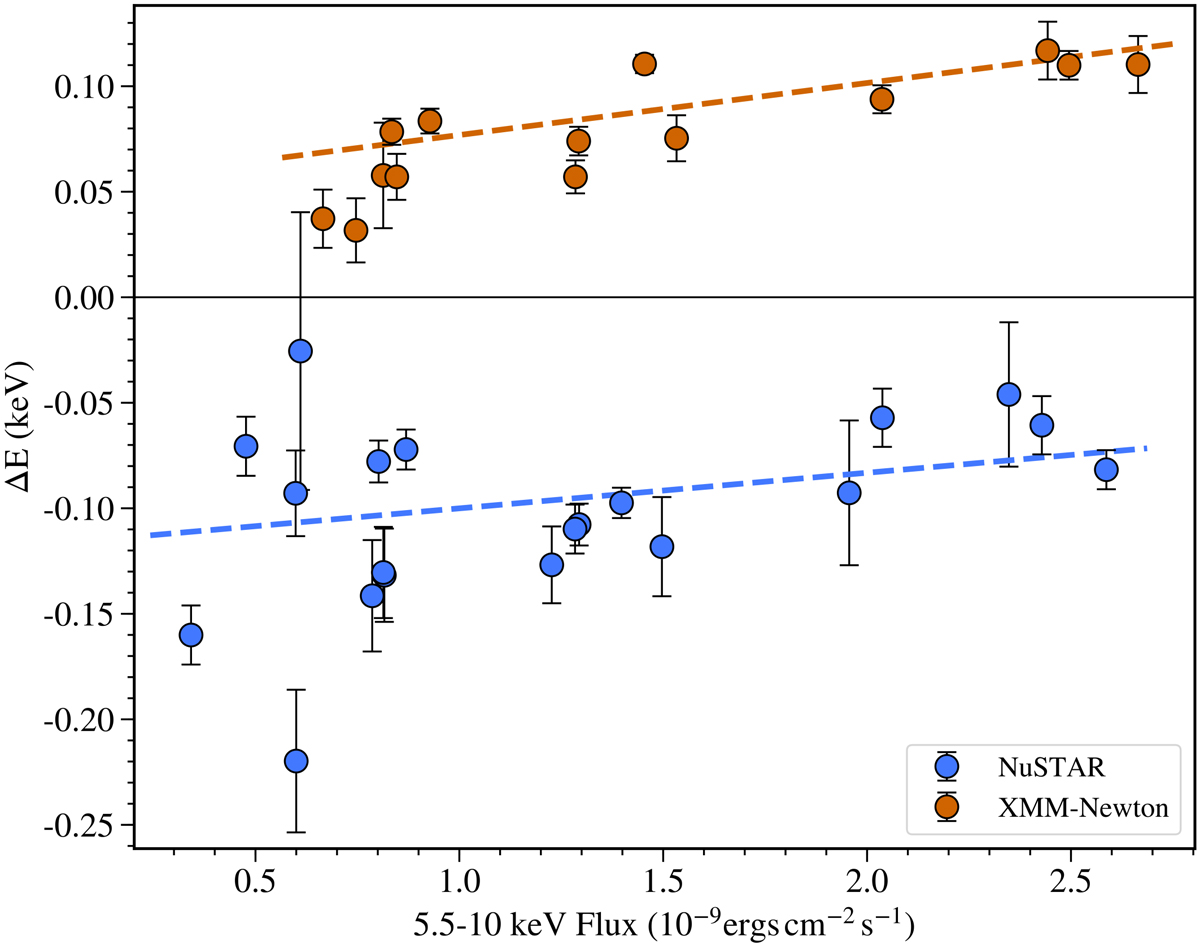
Difference between the energy at the expected iron K-edge, at 7.112 keV, and the best fitted edge energy, in NuSTAR and XMM-Newton spectra. The energy shift was determined by fitting a simple zedge*diskbb model to spectra confined to the energy range of 5.5–9 keV.
Current usage metrics show cumulative count of Article Views (full-text article views including HTML views, PDF and ePub downloads, according to the available data) and Abstracts Views on Vision4Press platform.
Data correspond to usage on the plateform after 2015. The current usage metrics is available 48-96 hours after online publication and is updated daily on week days.
Initial download of the metrics may take a while.