Fig. 15.
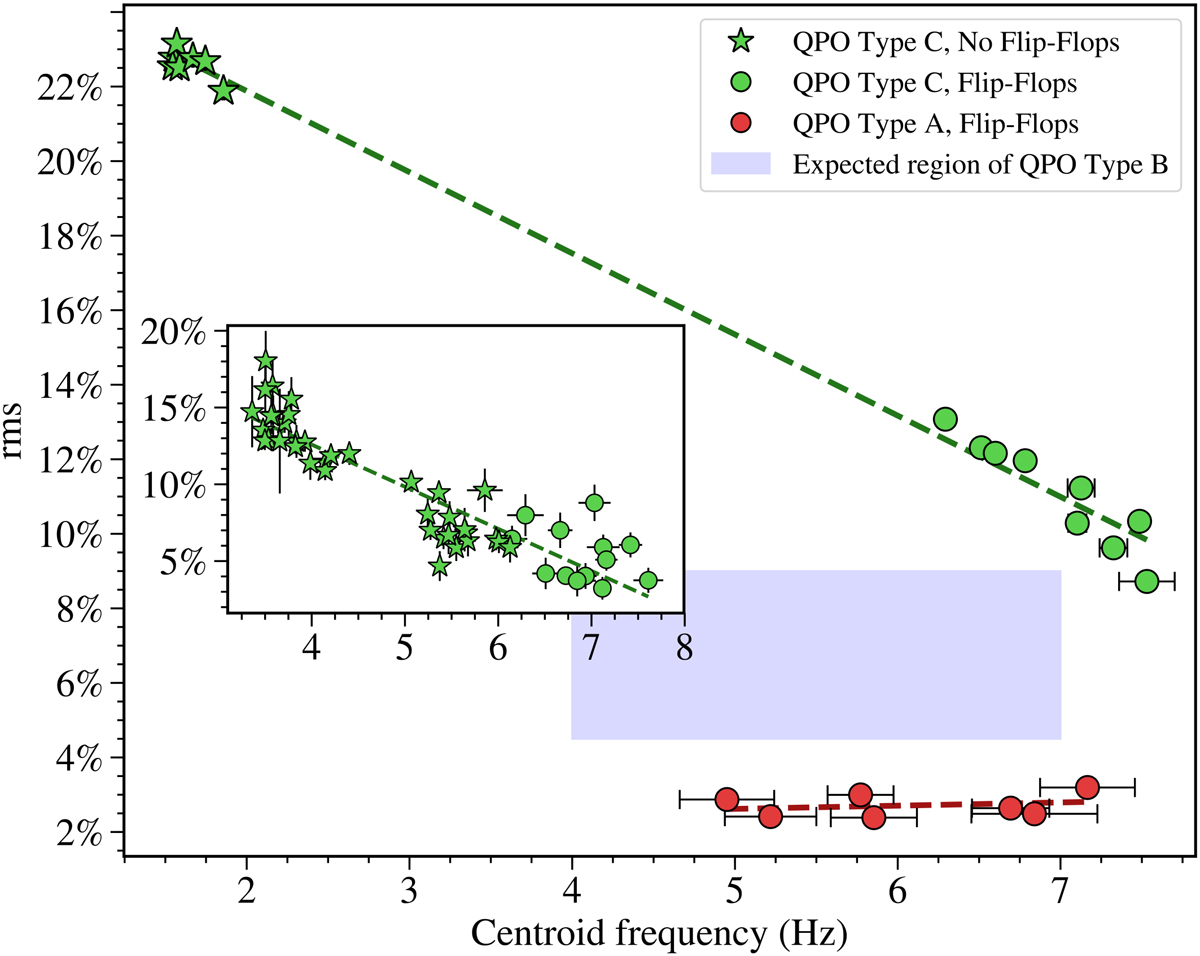
Total integrated rms and QPO centroid frequency of each orbit from the two Astrosat observations. The inset shows the centroid frequency, and the corrected rms in the QPO, detected in individual orbits of NuSTAR, and in 2 ks regions of the XMM-Newton light curves. Total rms values are computed in the 0.5–50 Hz range. We use colours and shapes to distinguish the type of QPO, and whether the measurement was made during the flip-flop period, or not.
Current usage metrics show cumulative count of Article Views (full-text article views including HTML views, PDF and ePub downloads, according to the available data) and Abstracts Views on Vision4Press platform.
Data correspond to usage on the plateform after 2015. The current usage metrics is available 48-96 hours after online publication and is updated daily on week days.
Initial download of the metrics may take a while.