Fig. 14.
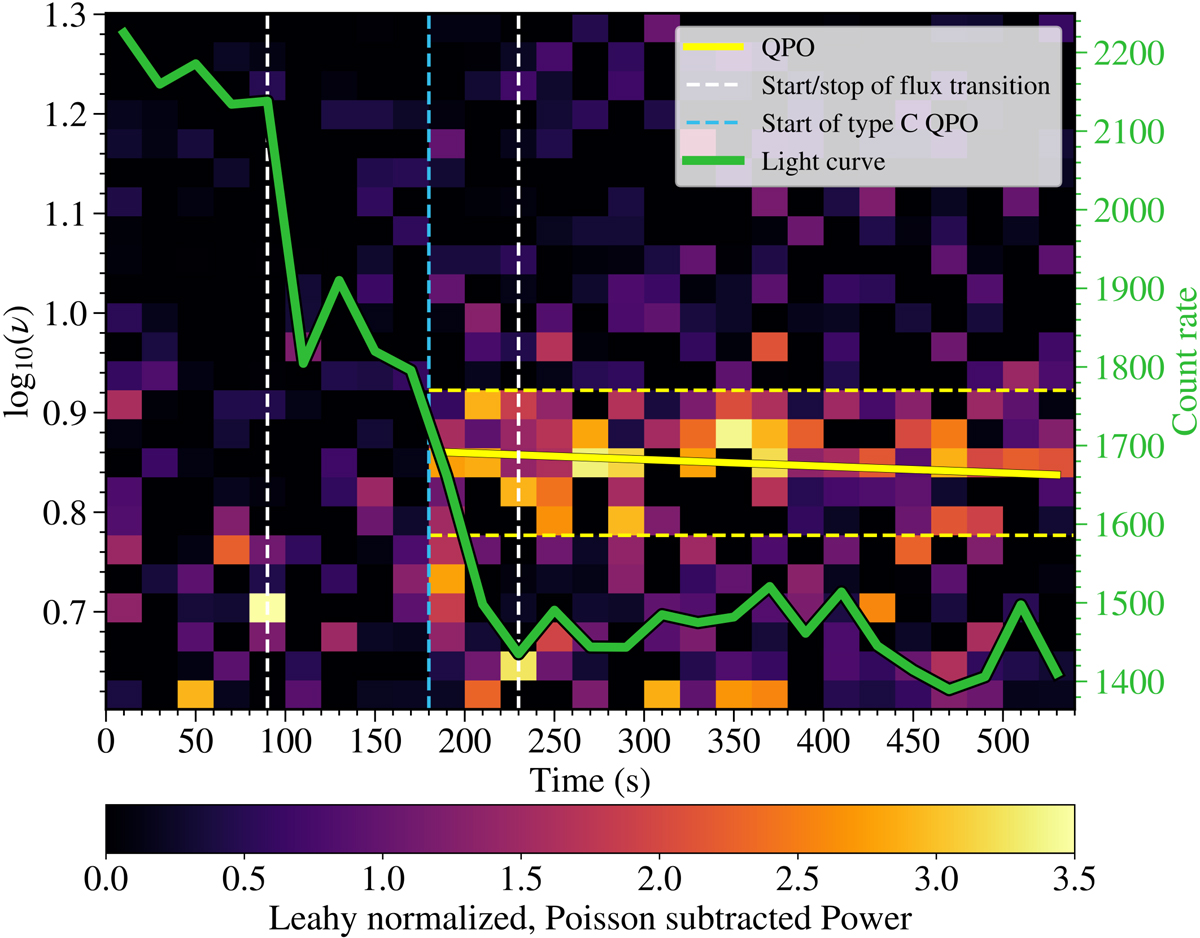
Spectrogram of the last flip-flop transition shown in Fig. 12. Colours denote the Leahy normalised, Poisson noise subtracted power. The light curve is plotted in green. The time is measured in seconds of observing time since the start of the orbit. We computed the PDS, and the average count rate, for each of the 20 s intervals into which we divided the data. We plotted a smaller frequency range for this figure, due to significant noise at low frequencies, a consequence of the short interval size.
Current usage metrics show cumulative count of Article Views (full-text article views including HTML views, PDF and ePub downloads, according to the available data) and Abstracts Views on Vision4Press platform.
Data correspond to usage on the plateform after 2015. The current usage metrics is available 48-96 hours after online publication and is updated daily on week days.
Initial download of the metrics may take a while.