Fig. 13.
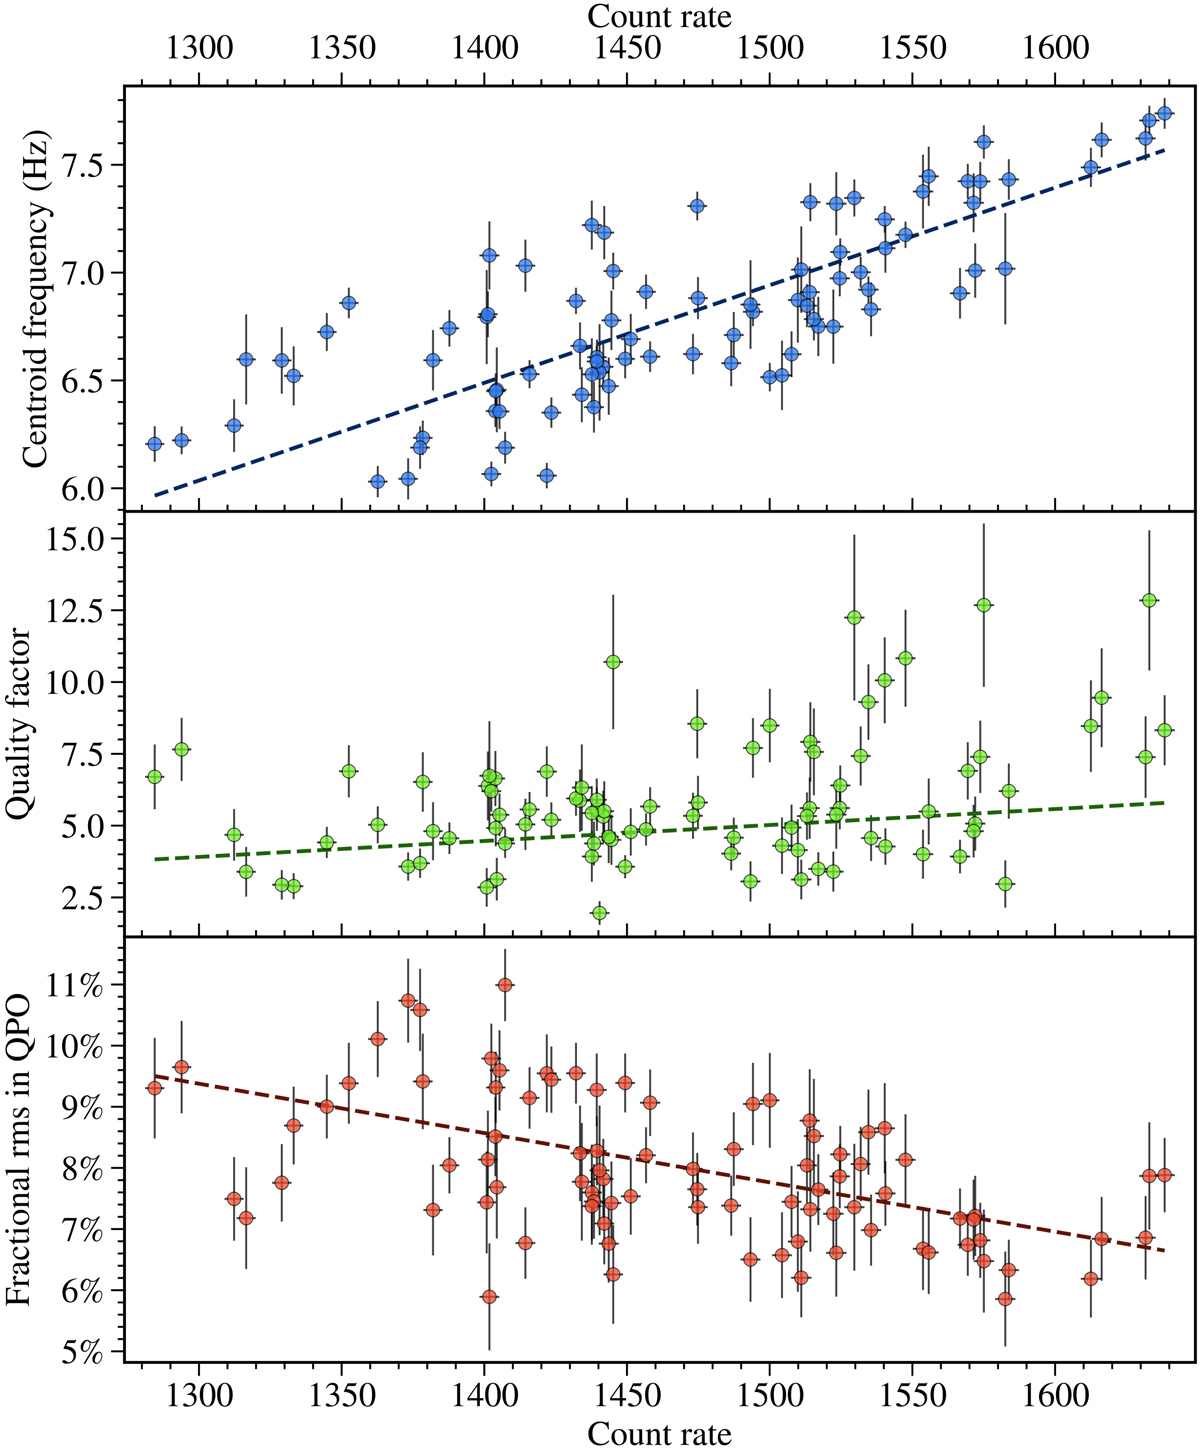
Correlation between the best QPO fitting parameters and the count rate, in each of the 200 s intervals of Fig. 12. We fitted each PDS between 4 and 10 Hz with a Lorentzian added to a straight line with a constant gradient. The properties of the Lorentzian were extracted to determine the centroid frequency, quality factor, and fractional rms in the QPO.
Current usage metrics show cumulative count of Article Views (full-text article views including HTML views, PDF and ePub downloads, according to the available data) and Abstracts Views on Vision4Press platform.
Data correspond to usage on the plateform after 2015. The current usage metrics is available 48-96 hours after online publication and is updated daily on week days.
Initial download of the metrics may take a while.