Fig. 12.
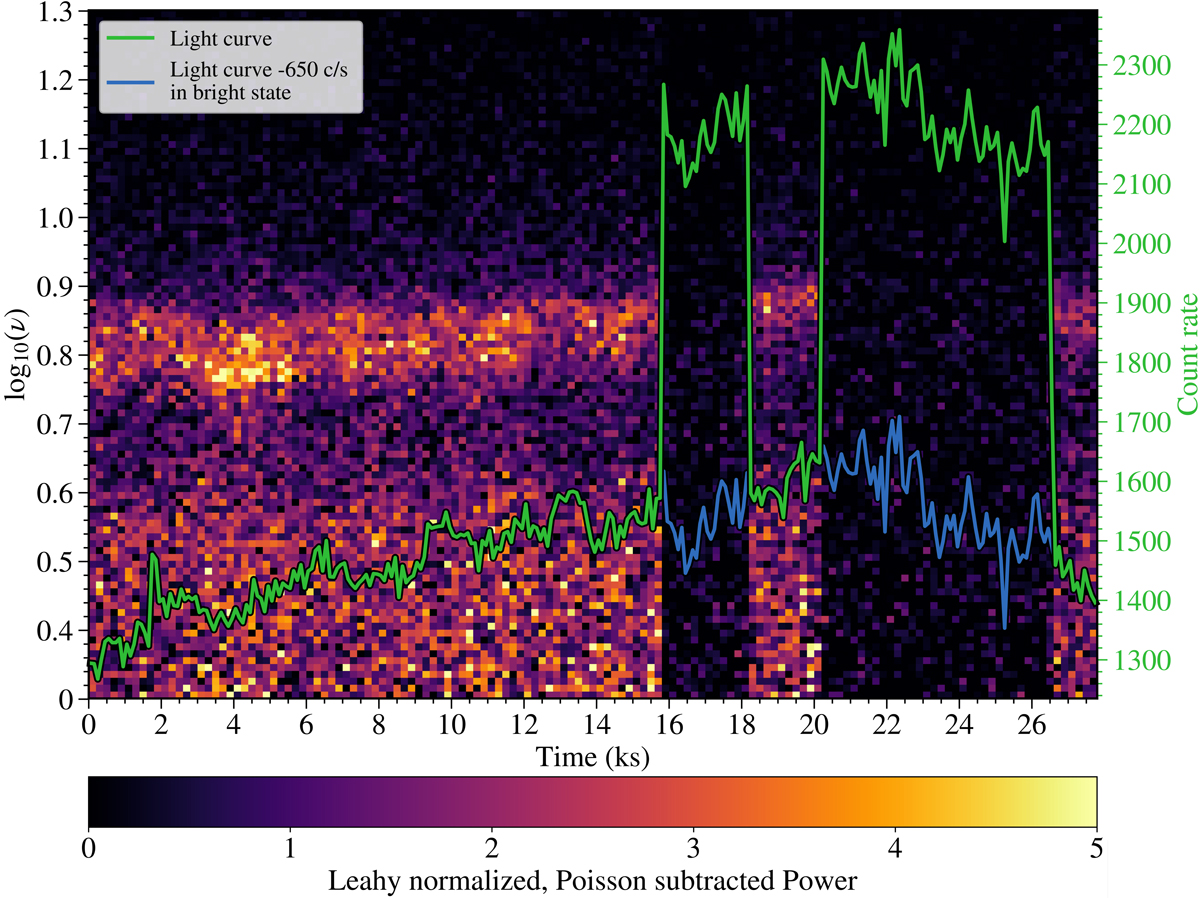
Spectrogram of the second Astrosat observation, starting on MJD 58180.786, with an overplotted light curve. Colours denote the Leahy normalised, Poisson noise subtracted power. The light curve is plotted in green, the blue curve represents the same light curve, but with a count rate reduced by 650 counts/s in the bright states. Gaps in the observations due to the low Earth orbit of Astrosat have been left out for display clarity. The time is measured in seconds of observing time since the start of the observation. The light curve is split into 200 s segments, for which the average count rate and the PDS were computed. The PDS frequencies are rebinned on a logarithmic scale. The first three state transitions shown here all lie within gaps in the data. We do however see the entire fourth transition, near the end of the observation.
Current usage metrics show cumulative count of Article Views (full-text article views including HTML views, PDF and ePub downloads, according to the available data) and Abstracts Views on Vision4Press platform.
Data correspond to usage on the plateform after 2015. The current usage metrics is available 48-96 hours after online publication and is updated daily on week days.
Initial download of the metrics may take a while.