Fig. 1.
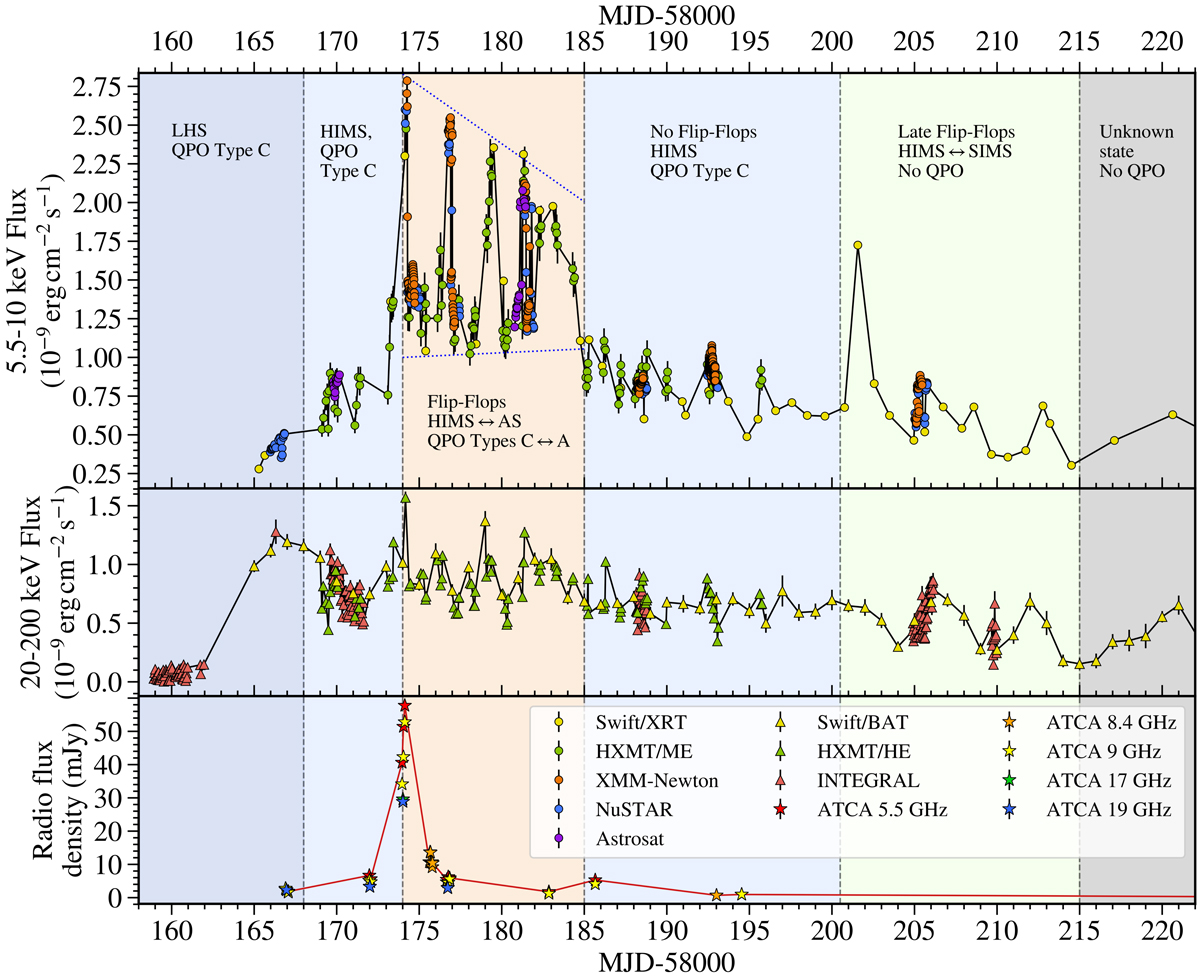
Light curve of the 2018 outburst of Swift J1658.2-4242 in three different energy bands. The top figure shows the flux in an intermediate energy X-ray band of 5.5–10 keV, as observed by Swift/XRT, Insight-HXMT/ME, XMM-Newton, NuSTAR, and Astrosat. In the second graph we plot the Swift/BAT, Insight-HXMT/HE, and INTEGRAL light curves in the hard X-ray band of 20–200 keV. The radio light curves at 5.5, 8.4, 9, 17, and 19 GHz detected by ATCA are plotted in the lowest graph. We split the data temporally into six regions. The initial flux increase and spectral softening in the LHS and HIMS, the flip-flops, the intermediate HIMS sandwiched between the two flip-flop intervals, the late flip-flops, and finally another interval for which we lack data to characterise accurately. The rest of the outburst was also observed, and analysed, but we primarily focused on the regions shown here. We scaled the count rates of Astrosat, Insight-HXMT, and Swift/BAT to agree with observed fluxes measured by other telescopes. For both Astrosat, and Insight-HXMT we used the count rate in the same energy band, but the Swift/BAT light curve was obtained for the 15–150 keV range, rather than the 20–200 keV interval. We optimised the conversion factors by determining the overlap between the scaled counts and the actual fluxes measured by other instruments. Due to changes in the spectrum, a single conversion factor from count rate to flux is not accurate everywhere. This is the reason for the divergence of the Insight-HXMT and Swift/XRT light curves in the region between the two flip-flop intervals. NuSTAR, XMM-Newton, Astrosat, Insight-HXMT/ME, and Insight-HXMT/HE light curves were binned into 1 ks segments. Swift/XRT, Swift/BAT, INTEGRAL, and ATCA light curves were binned to one data point per observation. We restricted the energy range of Swift/XRT, NuSTAR, and XMM-Newton to 5.5–10 keV, to minimise the effects of the DSH, which has a significant impact on the spectra below 5.5 keV, and to ensure consistency between light curves of different instruments. We added 2.6% error to all Insight-HXMT/ME, and 1.3% error to all Insight-HXMT/HE measurements. Insight-HXMT/ME was affected by a significant background. The contribution of the background to the count rate was estimated to be 3.9 counts s−1 in the 5.5–10 keV range. The X-ray flare observed by Swift/XRT on MJD 58201 only appeared after correcting for the removed bad pixels in the image.
Current usage metrics show cumulative count of Article Views (full-text article views including HTML views, PDF and ePub downloads, according to the available data) and Abstracts Views on Vision4Press platform.
Data correspond to usage on the plateform after 2015. The current usage metrics is available 48-96 hours after online publication and is updated daily on week days.
Initial download of the metrics may take a while.