Free Access
Fig. 5.
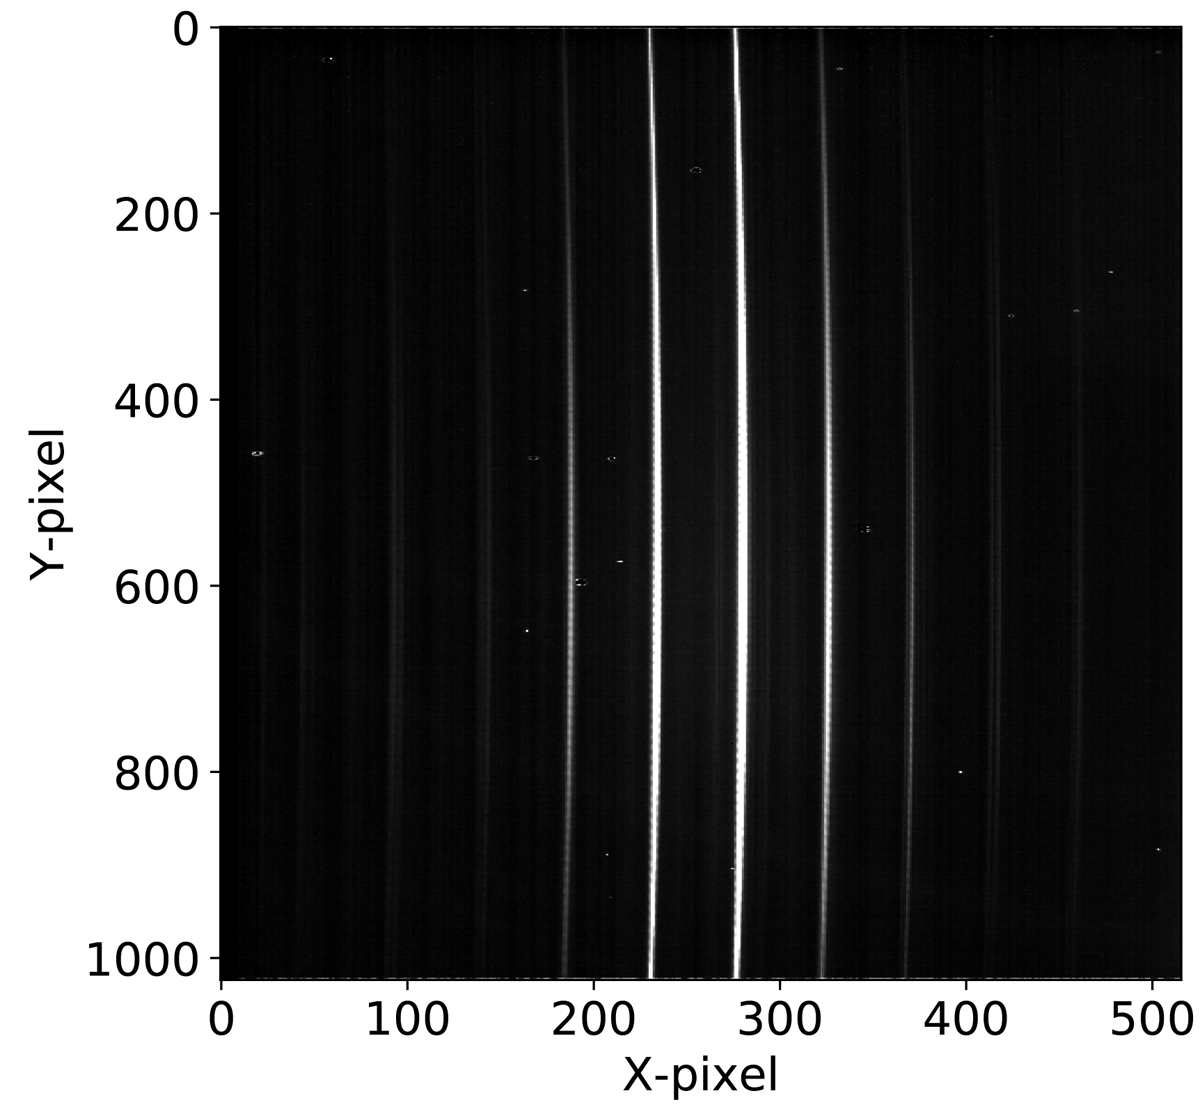
MRS point source spectrum on detector plane image. The intensity in the different traces varies as a function of the given part of the PSF that is sampled (core versus wings). The signal contrast has been selected to allow for the visualisation of the slices in which the point source is significantly detected.
Current usage metrics show cumulative count of Article Views (full-text article views including HTML views, PDF and ePub downloads, according to the available data) and Abstracts Views on Vision4Press platform.
Data correspond to usage on the plateform after 2015. The current usage metrics is available 48-96 hours after online publication and is updated daily on week days.
Initial download of the metrics may take a while.