Fig. 24.
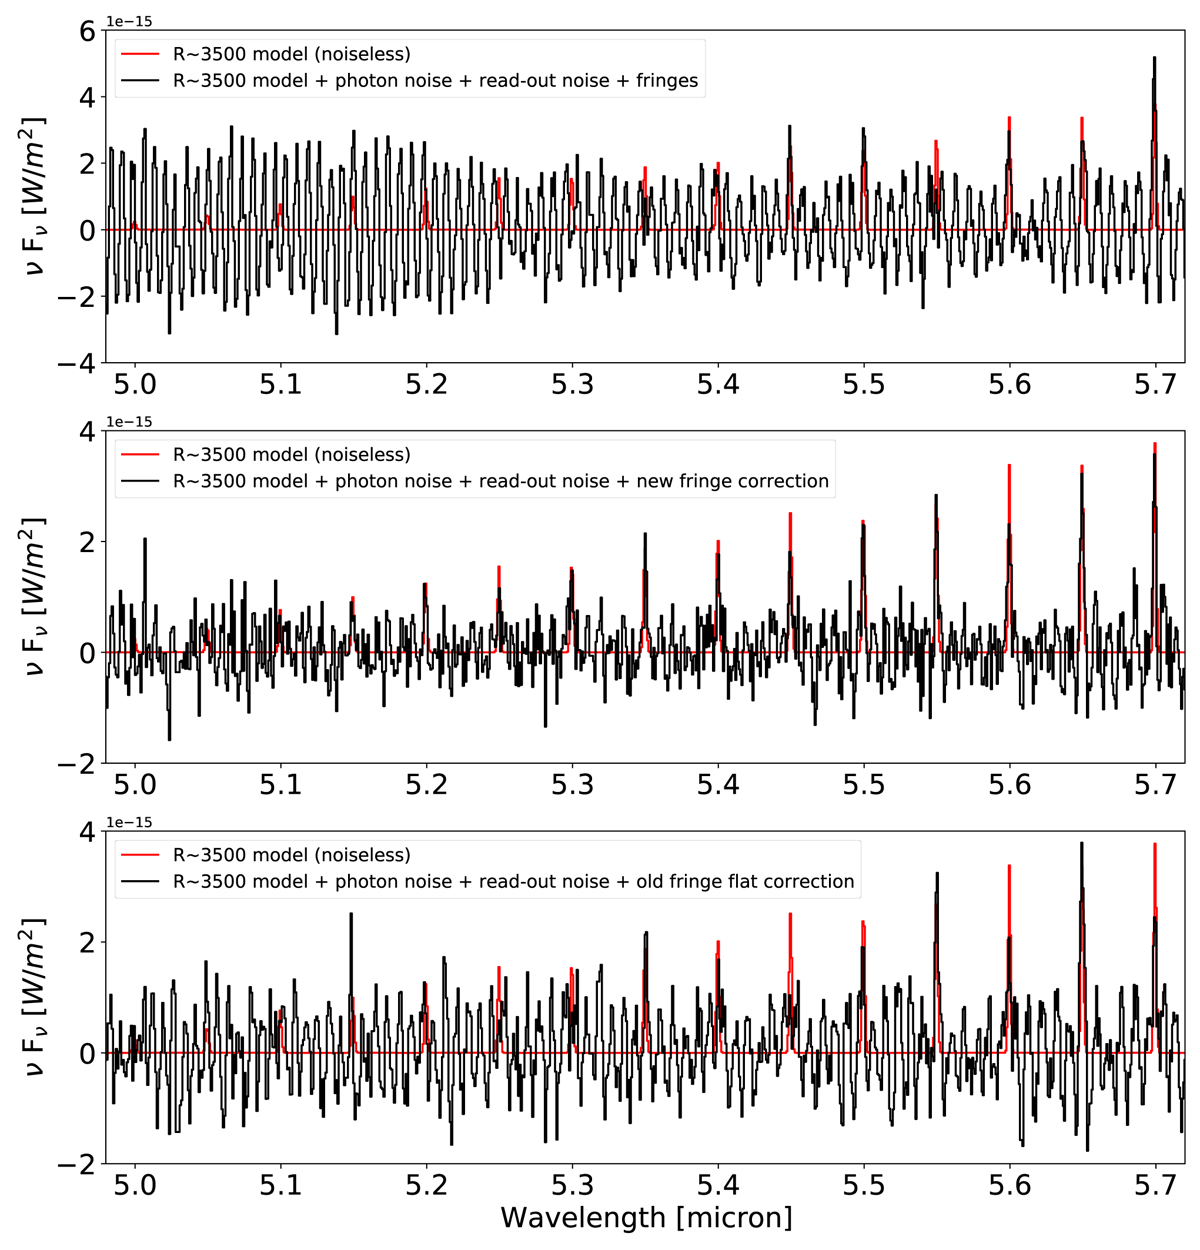
Top plot: no fringe correction applied to model spectrum. Middle plot: new fringe correction applied to data. Weakest detectable line has a spectral irradiance of 1 × 10⁻¹⁵ W/m2 (located at 5.2 μm). Bottom plot: old extended source fringe flat applied to data. Weakest detectable line has a spectral irradiance of 2 × 10⁻¹⁵ W/m2 (located at 5.35 μm).
Current usage metrics show cumulative count of Article Views (full-text article views including HTML views, PDF and ePub downloads, according to the available data) and Abstracts Views on Vision4Press platform.
Data correspond to usage on the plateform after 2015. The current usage metrics is available 48-96 hours after online publication and is updated daily on week days.
Initial download of the metrics may take a while.