Fig. 23.
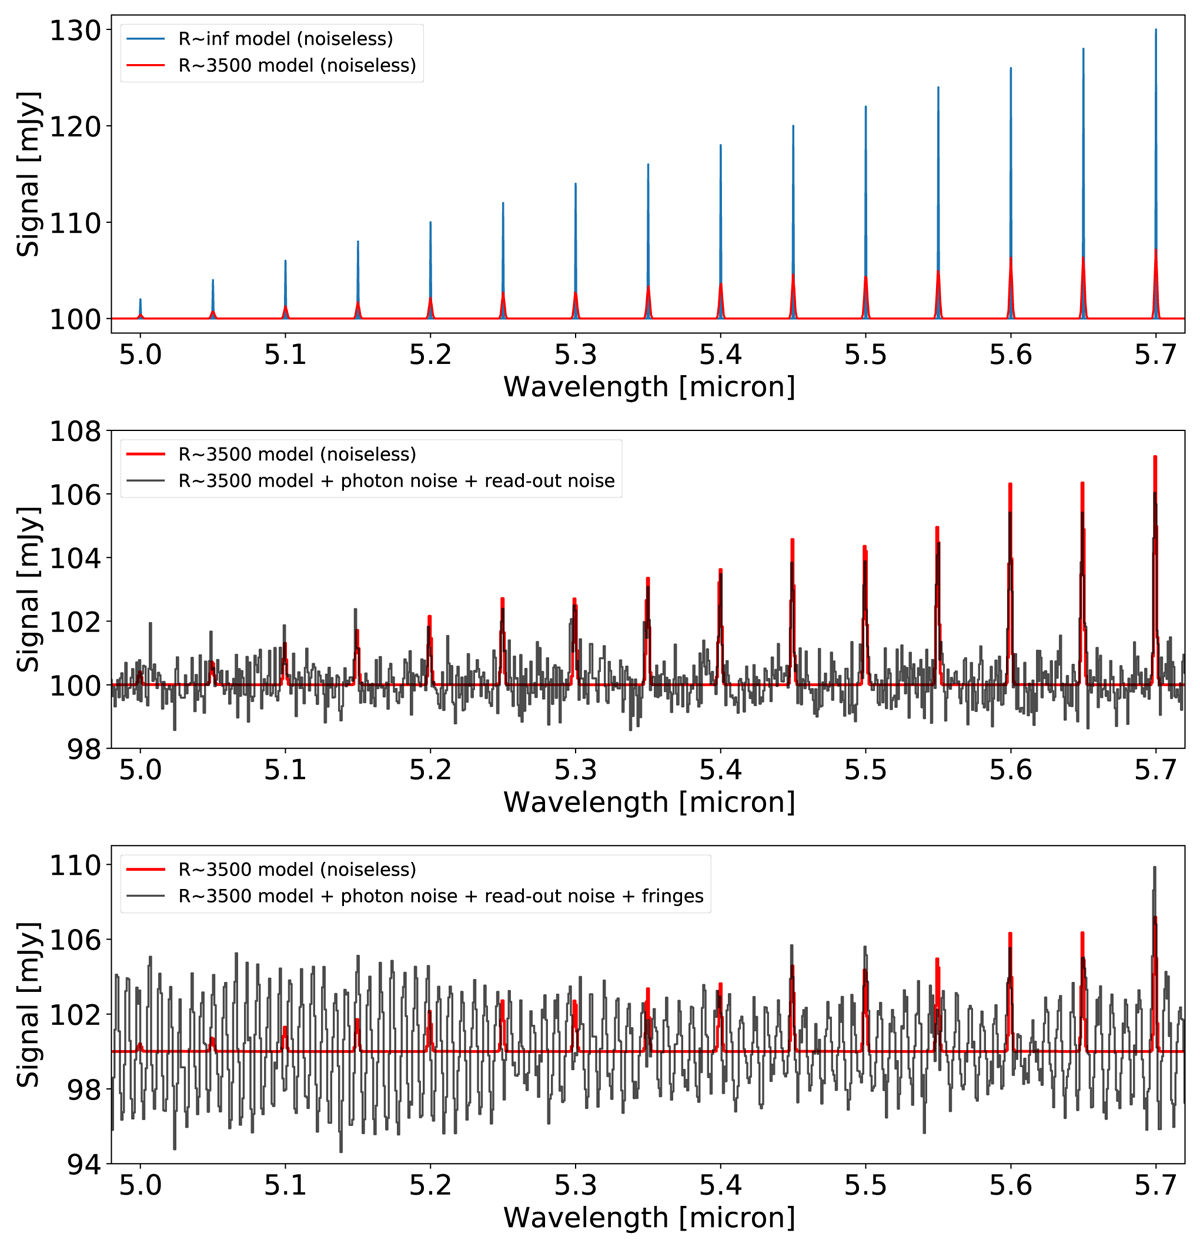
Top plot: initial model spectrum at two spectral resolutions. Middle plot: degraded model spectrum with and without including photon noise and read-out noise. Bottom plot: step plot of model spectrum at MIRI MRS resolution with photon noise, read-out noise, and fringes. The applied fringes are sourced from a CV integrated point source spectrum.
Current usage metrics show cumulative count of Article Views (full-text article views including HTML views, PDF and ePub downloads, according to the available data) and Abstracts Views on Vision4Press platform.
Data correspond to usage on the plateform after 2015. The current usage metrics is available 48-96 hours after online publication and is updated daily on week days.
Initial download of the metrics may take a while.