Free Access
Fig. 19.
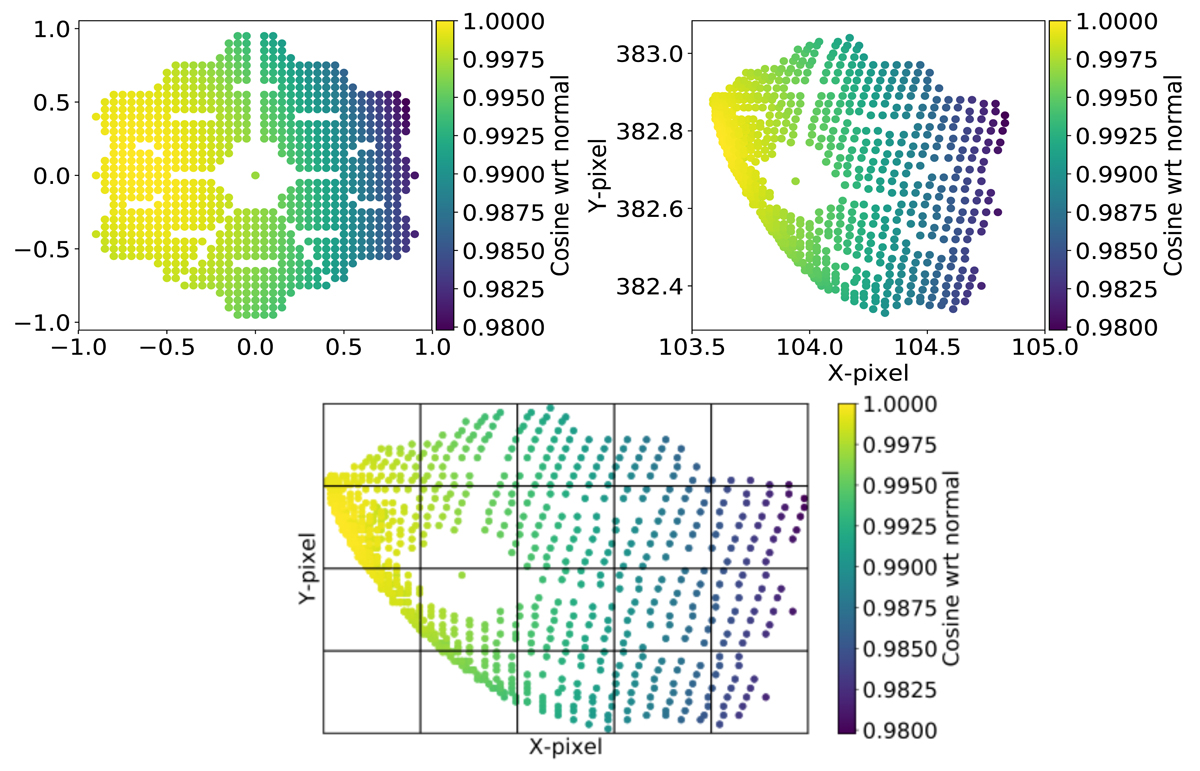
Top: MIRI MRS angle of incidence cosine spot diagram computed using the Zemax model of the MIRI instrument. Bottom: artificial 5-by-4 pixel grid overplotted on the detector spot diagram shown in the right plot of Fig. 19. This offers a simplistic view of the incidence angle distribution across the real MRS PSF.
Current usage metrics show cumulative count of Article Views (full-text article views including HTML views, PDF and ePub downloads, according to the available data) and Abstracts Views on Vision4Press platform.
Data correspond to usage on the plateform after 2015. The current usage metrics is available 48-96 hours after online publication and is updated daily on week days.
Initial download of the metrics may take a while.