Free Access
Fig. 17.
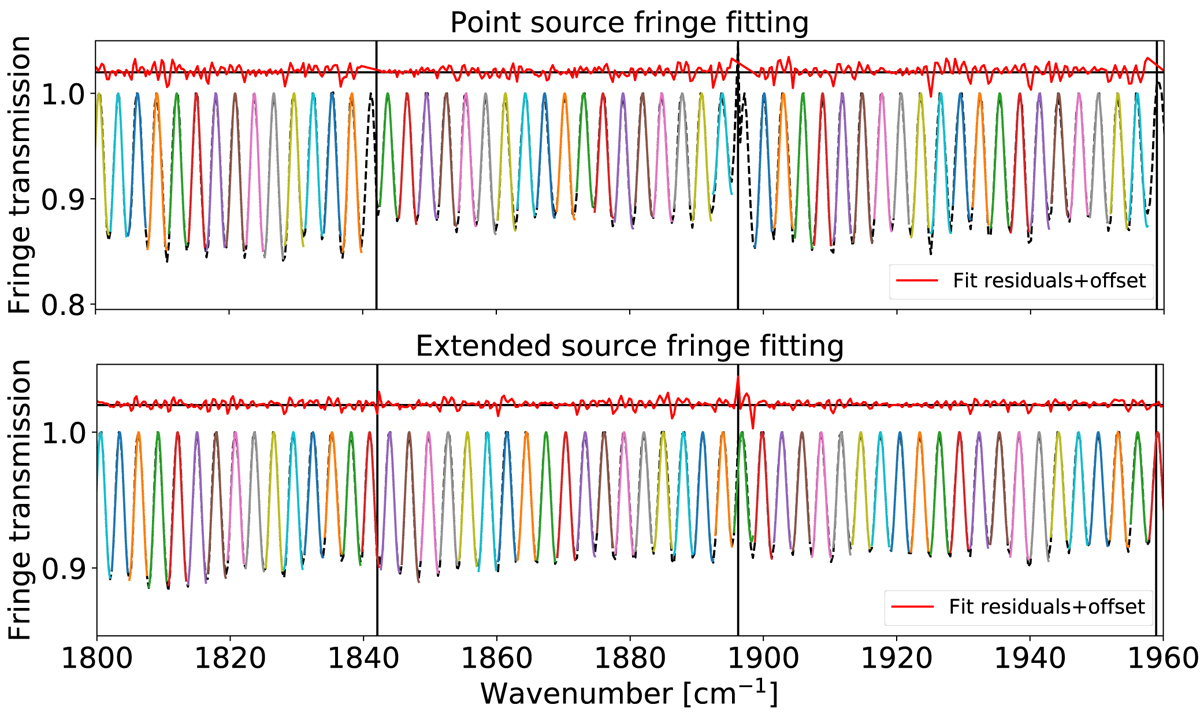
Fitting of point source and extended source fringe peaks over a subset of the wavelength range. The fits are overplotted on the original fringe transmission of the respective sources, shown with a dashed black line.
Current usage metrics show cumulative count of Article Views (full-text article views including HTML views, PDF and ePub downloads, according to the available data) and Abstracts Views on Vision4Press platform.
Data correspond to usage on the plateform after 2015. The current usage metrics is available 48-96 hours after online publication and is updated daily on week days.
Initial download of the metrics may take a while.