Fig. 8.
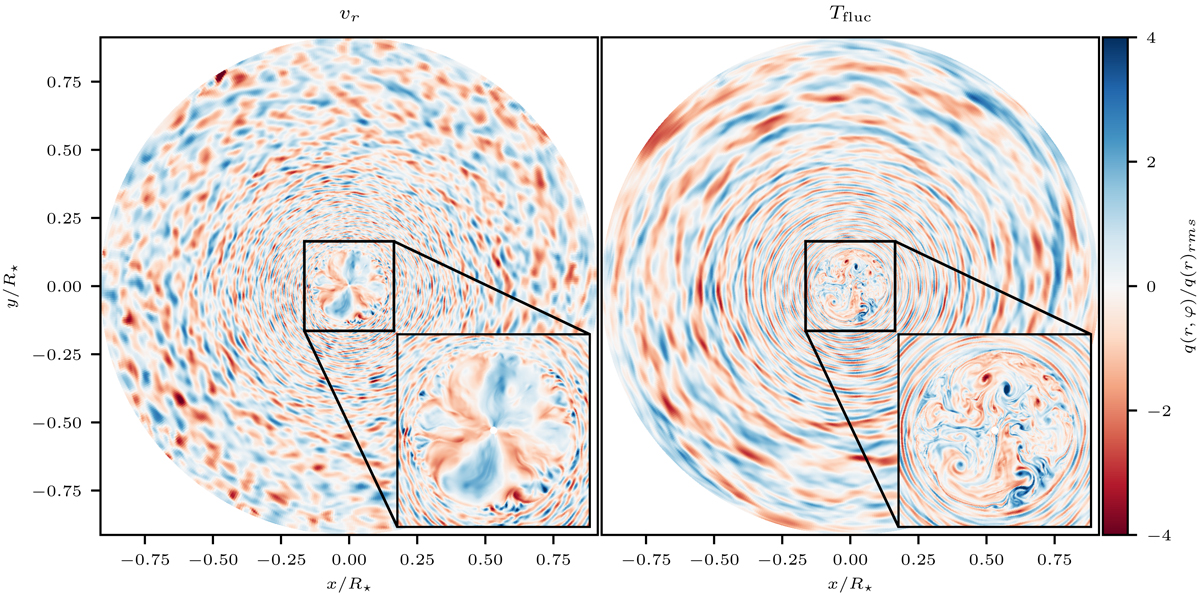
Radial velocity vr and temperature fluctuations Tfluc. As both quantities have larger amplitudes at the outer parts of the model (see further Sect. 4.5) they have been scaled with the corresponding horizontal root-mean-square value at each radius r to ease the visualization. Both panels also show a magnification of the core region. The shown snapshot is taken at t ∼ 580 h. There is also a movie available on https://zenodo.org/record/3819569.
Current usage metrics show cumulative count of Article Views (full-text article views including HTML views, PDF and ePub downloads, according to the available data) and Abstracts Views on Vision4Press platform.
Data correspond to usage on the plateform after 2015. The current usage metrics is available 48-96 hours after online publication and is updated daily on week days.
Initial download of the metrics may take a while.