Fig. 7.
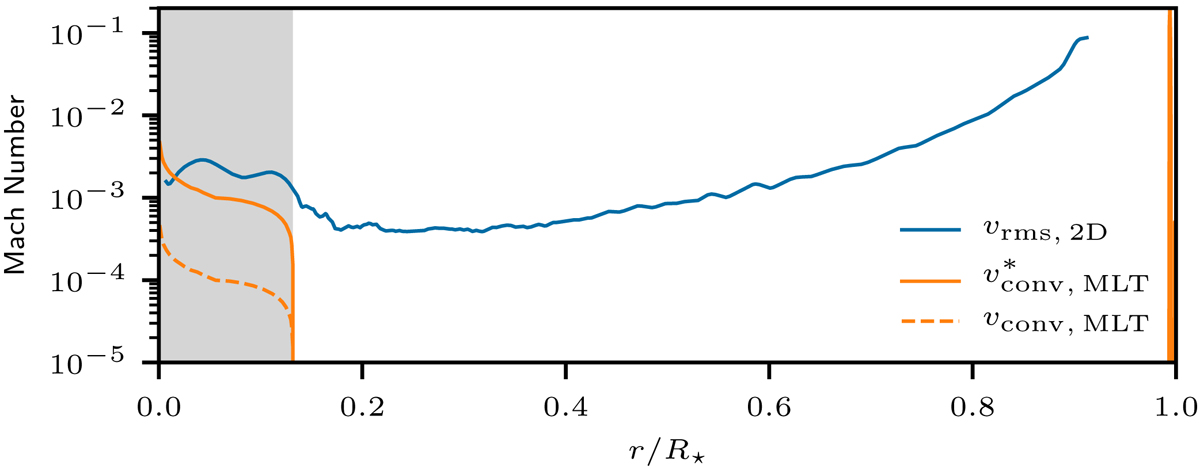
Predicted and simulated Mach numbers of the 2D model. The orange lines correspond to the MLT prediction: the dashed profile shows the original stellar values, whereas the solid line illustrates the velocities scaled by 10, according to Eq. (30). The blue line shows the 2D results averaged over roughly two convective turnover times, starting at t = 500 h. The profile ends at r ≈ 0.9 R⋆ as our domain does not contain the entire star model. The gray shaded areas mark the convective core and the small region of surface convection in the 1D model.
Current usage metrics show cumulative count of Article Views (full-text article views including HTML views, PDF and ePub downloads, according to the available data) and Abstracts Views on Vision4Press platform.
Data correspond to usage on the plateform after 2015. The current usage metrics is available 48-96 hours after online publication and is updated daily on week days.
Initial download of the metrics may take a while.