Fig. B.2.
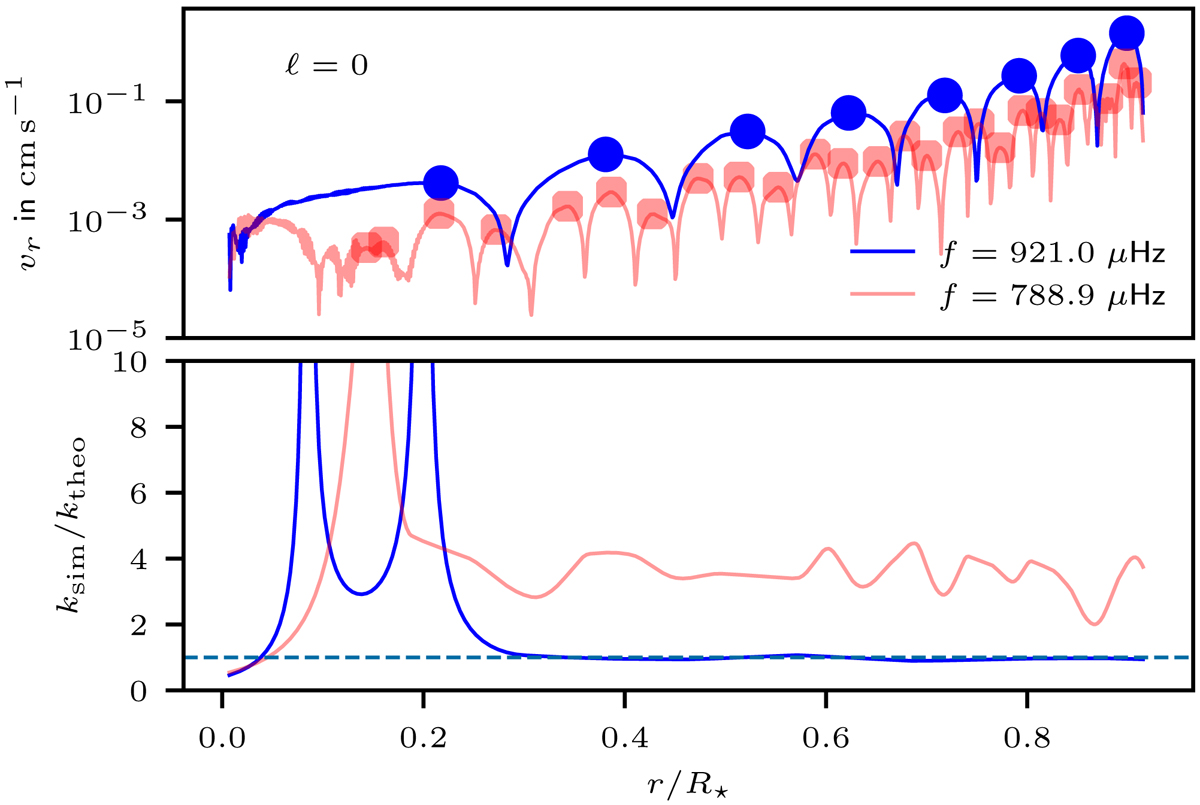
Check for the dispersion relation of sound waves. Upper panel: amplitudes of the radial velocity at two different frequencies for ℓ = 0. Circles mark radii where our routine detects peaks in the amplitude. The radial wavelengths are then estimated from the distance of neighboring peaks. For the blue line, the frequency matches a standing mode and it shows well defined, distinct peaks. The red line corresponds to a frequency which is between standing modes and shows small-scale incoherent oscillations with many peaks. Lower panel: resulting wave numbers from the simulation are compared to the expectation for sound waves ktheo = 2πf/csound. We find the blue line in good agreement with theory for radii above the convection zone while the red line considerably differs.
Current usage metrics show cumulative count of Article Views (full-text article views including HTML views, PDF and ePub downloads, according to the available data) and Abstracts Views on Vision4Press platform.
Data correspond to usage on the plateform after 2015. The current usage metrics is available 48-96 hours after online publication and is updated daily on week days.
Initial download of the metrics may take a while.