Fig. B.1.
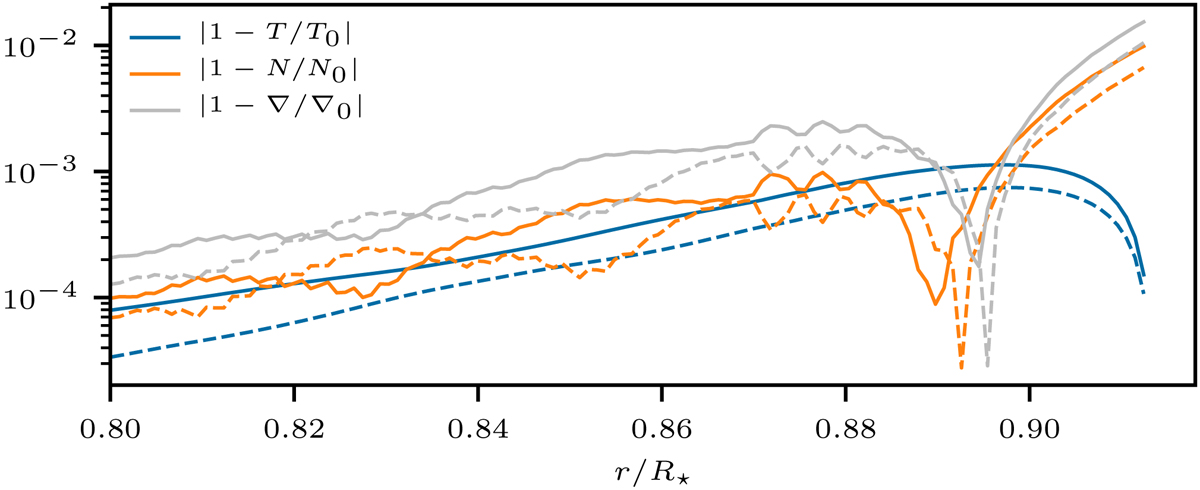
Relative deviation from the initial profile for the 1D simulations described in Sect. 4.1 at t ∼ 1100 h. Shown are results for the temperature T, the BVF N, and the temperature gradient ∇ = ∂ log T/∂ log P, respectively. Solid lines correspond to cylindrical geometry whereas dashed lines denote the results for spherical geometry. Only the surface of the computational domain is shown to emphasize the change at the outer radial boundary. The deviations are even smaller in the inner part which is not shown here.
Current usage metrics show cumulative count of Article Views (full-text article views including HTML views, PDF and ePub downloads, according to the available data) and Abstracts Views on Vision4Press platform.
Data correspond to usage on the plateform after 2015. The current usage metrics is available 48-96 hours after online publication and is updated daily on week days.
Initial download of the metrics may take a while.