Fig. 19.
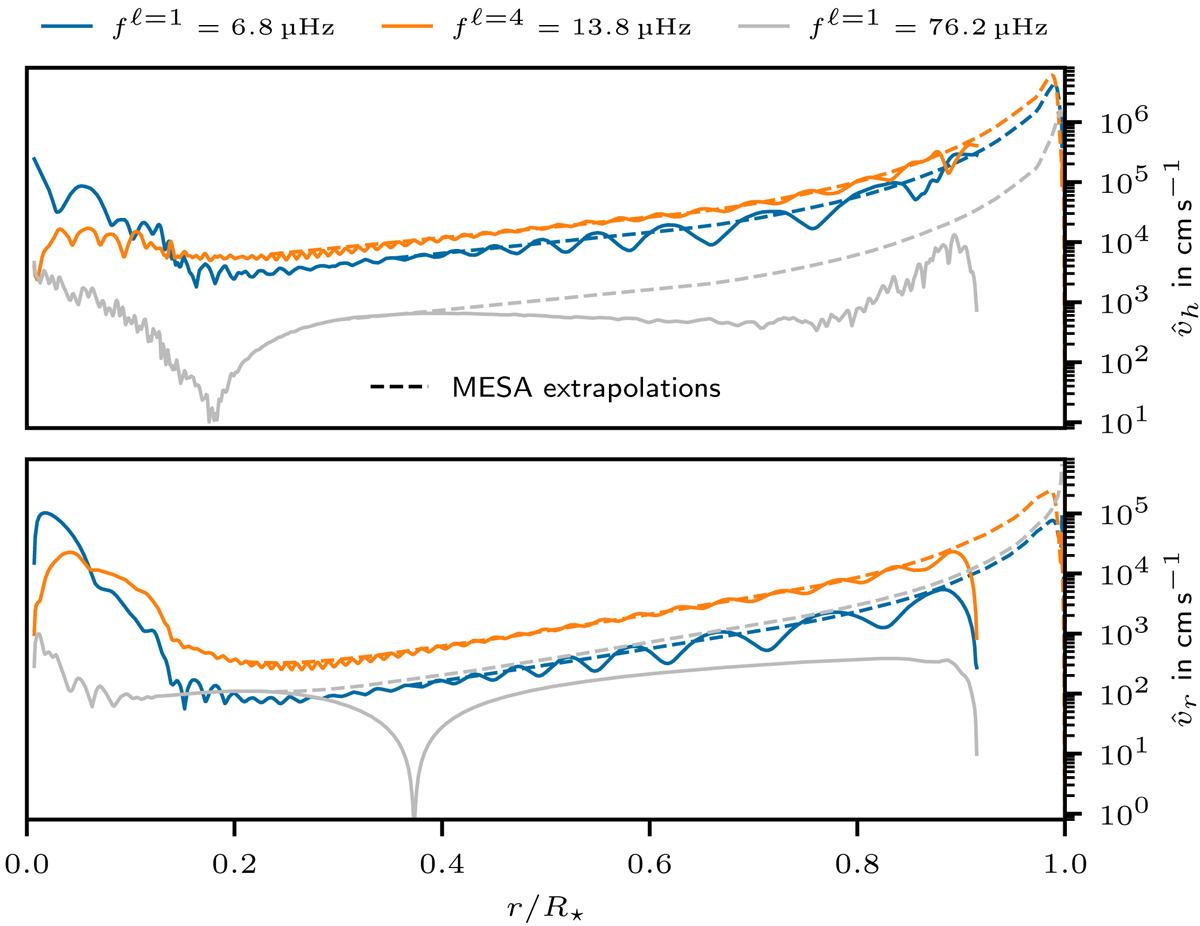
Velocity amplitude for different frequencies and angular degrees ℓ as function of radius. The amplitudes also include the contribution of the two adjacent frequency bins to account for the fact that peaks typically show a width of two to four bins in our simulation. The expected amplification toward the surface according to Eq. (42) is represented by dashed lines; the 1D MESA profile data serve as input variables whereas the starting points are taken as the simulated amplitudes at the first noticeable local maximum of the respective frequency and angular degree.
Current usage metrics show cumulative count of Article Views (full-text article views including HTML views, PDF and ePub downloads, according to the available data) and Abstracts Views on Vision4Press platform.
Data correspond to usage on the plateform after 2015. The current usage metrics is available 48-96 hours after online publication and is updated daily on week days.
Initial download of the metrics may take a while.