Fig. 17.
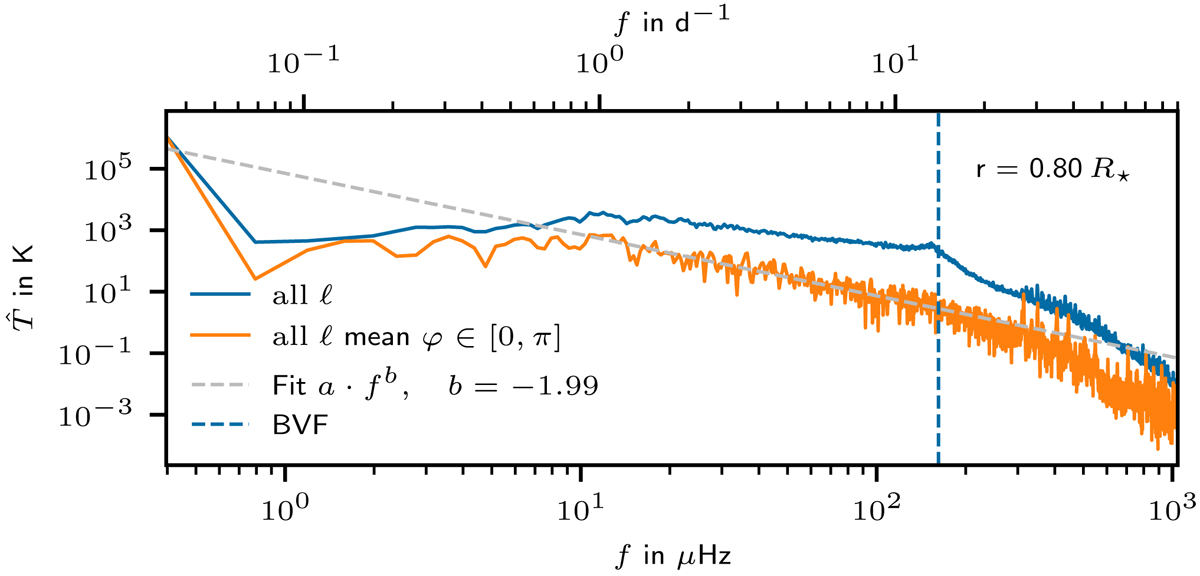
Spectra for temperature at r = 0.80 R⋆. The orange line shows the spectrum of the temperature fluctuations which have been averaged over half of the circumference of our 2D model. The blue line corresponds to the spectra averaged over 100 radial rays after the FT as it is done for the velocity spectra. The dashed blue vertical line denotes the position of the BVF. The gray line corresponds to a power-law fit for the frequencies ranging from 10 μHz to 200 μHz resulting in an exponent of b ≈ −2.
Current usage metrics show cumulative count of Article Views (full-text article views including HTML views, PDF and ePub downloads, according to the available data) and Abstracts Views on Vision4Press platform.
Data correspond to usage on the plateform after 2015. The current usage metrics is available 48-96 hours after online publication and is updated daily on week days.
Initial download of the metrics may take a while.