Fig. 15.
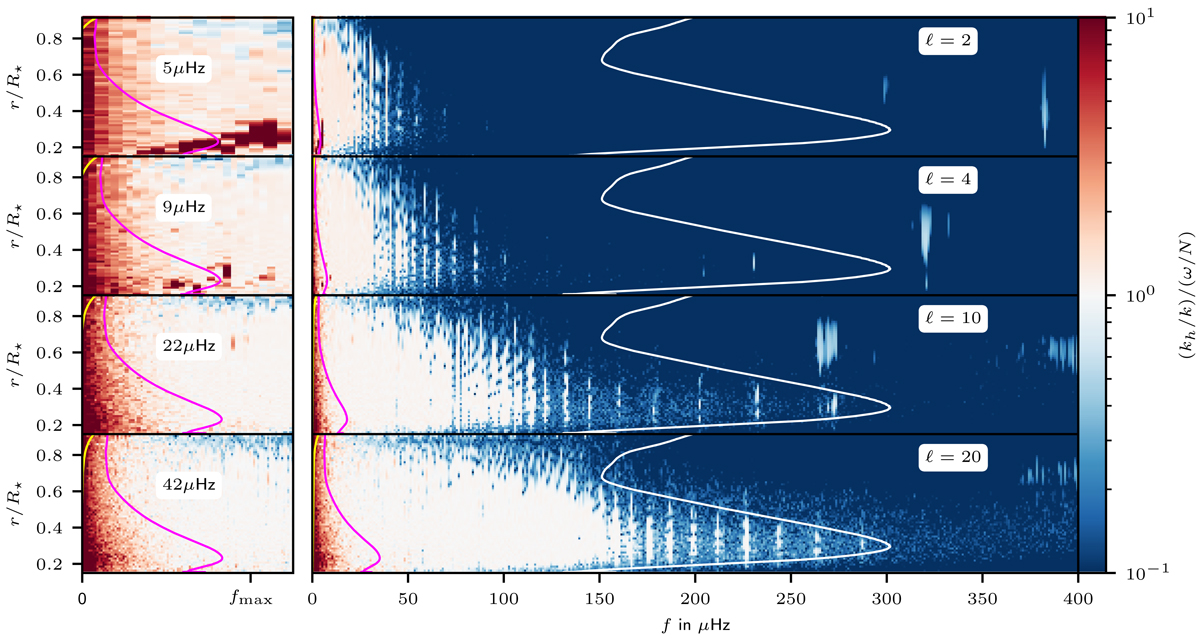
Ratio of the left and right side of the dispersion relation Eq. (36). The method to extract kh/k from the simulation is described in the text. A ratio of unity corresponds to a perfect match and is reflected by white regions. A red color indicates a too large value of kh/k and correspondingly the ratio is too small in blue regions. The white line is the BVF. For frequencies below the yellow line, IGWs are expected to be damped by thermal diffusion. Below the magenta line, the radial wavelength is resolved by less than 10 grid cells. The left column zooms into the low frequency region of the corresponding full plane on the right. The frequency given in the white boxes denotes the value of fmax which sets the scale of the corresponding x-axis.
Current usage metrics show cumulative count of Article Views (full-text article views including HTML views, PDF and ePub downloads, according to the available data) and Abstracts Views on Vision4Press platform.
Data correspond to usage on the plateform after 2015. The current usage metrics is available 48-96 hours after online publication and is updated daily on week days.
Initial download of the metrics may take a while.