Free Access
Fig. 14.
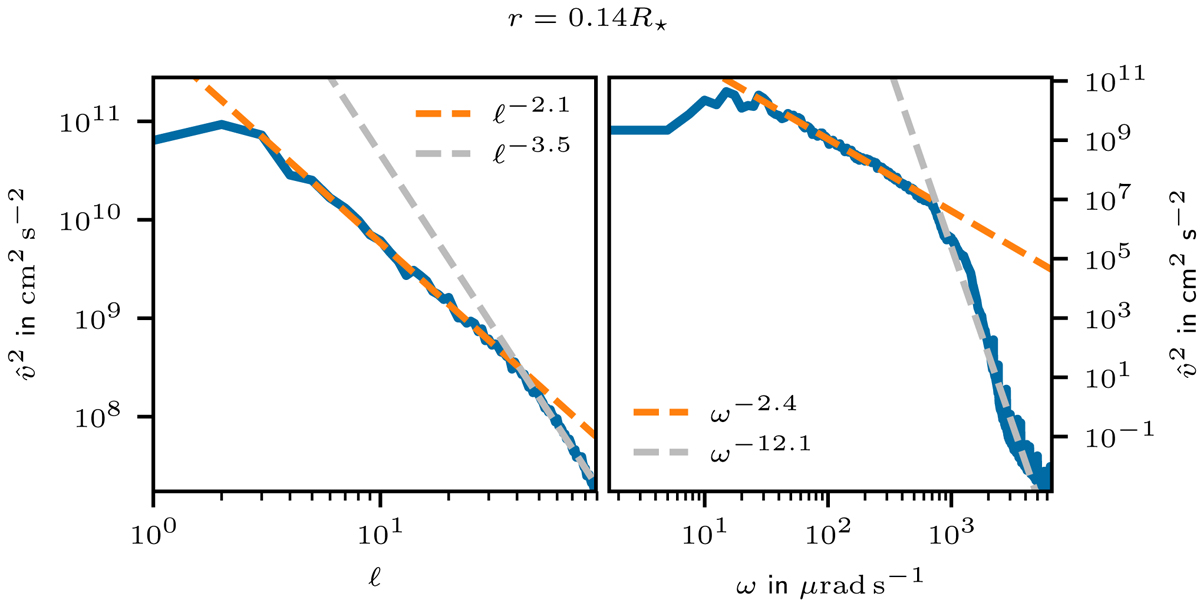
Kinetic energy as a function of angular degree ℓ (left panel) and angular frequency ω (right panel) at the top of the convection zone. Dashed lines correspond to power-law fits. This figure is similar to the second and third column in Fig. 6 of Rogers et al. (2013).
Current usage metrics show cumulative count of Article Views (full-text article views including HTML views, PDF and ePub downloads, according to the available data) and Abstracts Views on Vision4Press platform.
Data correspond to usage on the plateform after 2015. The current usage metrics is available 48-96 hours after online publication and is updated daily on week days.
Initial download of the metrics may take a while.