Fig. 11.
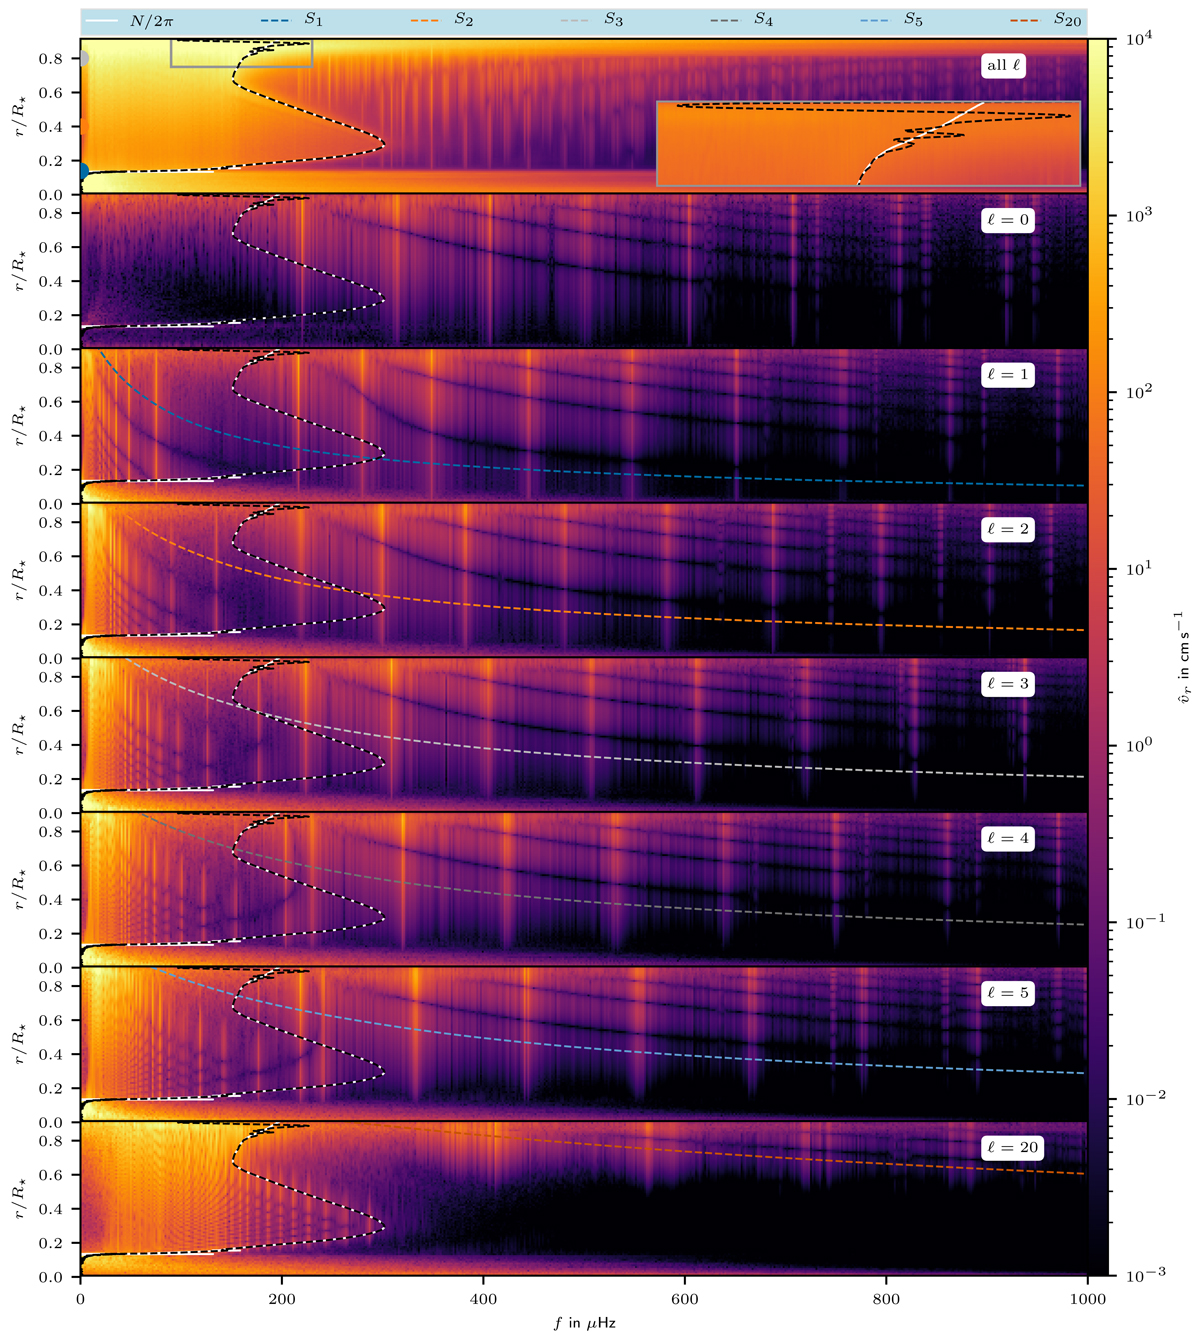
Frequency spectrum of the radial velocity for a time span of 700 h. The normalization is done in a way that the amplitude of a narrow line of one frequency bin width corresponds to the velocity amplitude of the corresponding wave in the time domain. The data is stored in intervals of 480 s. This allows us to capture frequencies up to fmax = 103 μHz with a resolution of δf = 0.4 μHz. In order to reduce the background noise, we show the average of the spectrum of 100 individual radial rays. The doublets for the modes with f ≳ 700 μHz are due to aliasing, which we verified with a simulation with a very short cadence of outputs. The three colored dots in the uppermost panel mark the radii for which the line profiles are shown in Fig. 16. The white and black lines correspond to the BVF at start and end of the simulation, respectively. Colored dashed lines correspond to the Lamb frequencies of different ℓ values according to Eq. (32). In the first row, the uppermost part of the model is magnified (gray box) in order to illustrate the change in the BVF at the end of the simulation. For the magnification, the color scale was adapted to increase the visibility of the lines. We show the spectra for the horizontal velocity in Fig. 12.
Current usage metrics show cumulative count of Article Views (full-text article views including HTML views, PDF and ePub downloads, according to the available data) and Abstracts Views on Vision4Press platform.
Data correspond to usage on the plateform after 2015. The current usage metrics is available 48-96 hours after online publication and is updated daily on week days.
Initial download of the metrics may take a while.