Free Access
Fig. 10.
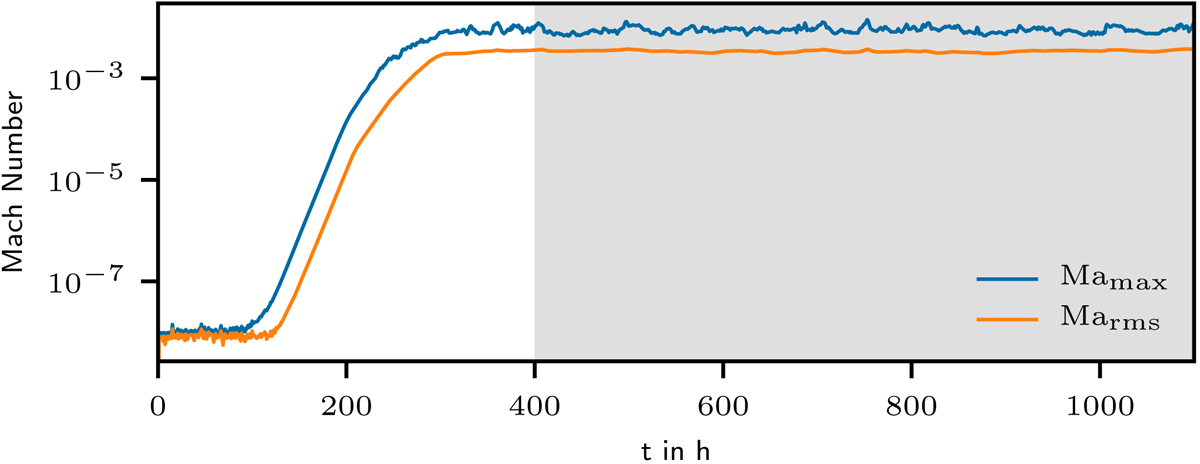
Maximum (blue) and root-mean-square (orange) Mach number in the convection zone as a function of time. The gray shaded area marks the time frame that has been used to extract the spectra that are presented in this paper.
Current usage metrics show cumulative count of Article Views (full-text article views including HTML views, PDF and ePub downloads, according to the available data) and Abstracts Views on Vision4Press platform.
Data correspond to usage on the plateform after 2015. The current usage metrics is available 48-96 hours after online publication and is updated daily on week days.
Initial download of the metrics may take a while.