Fig. 1.
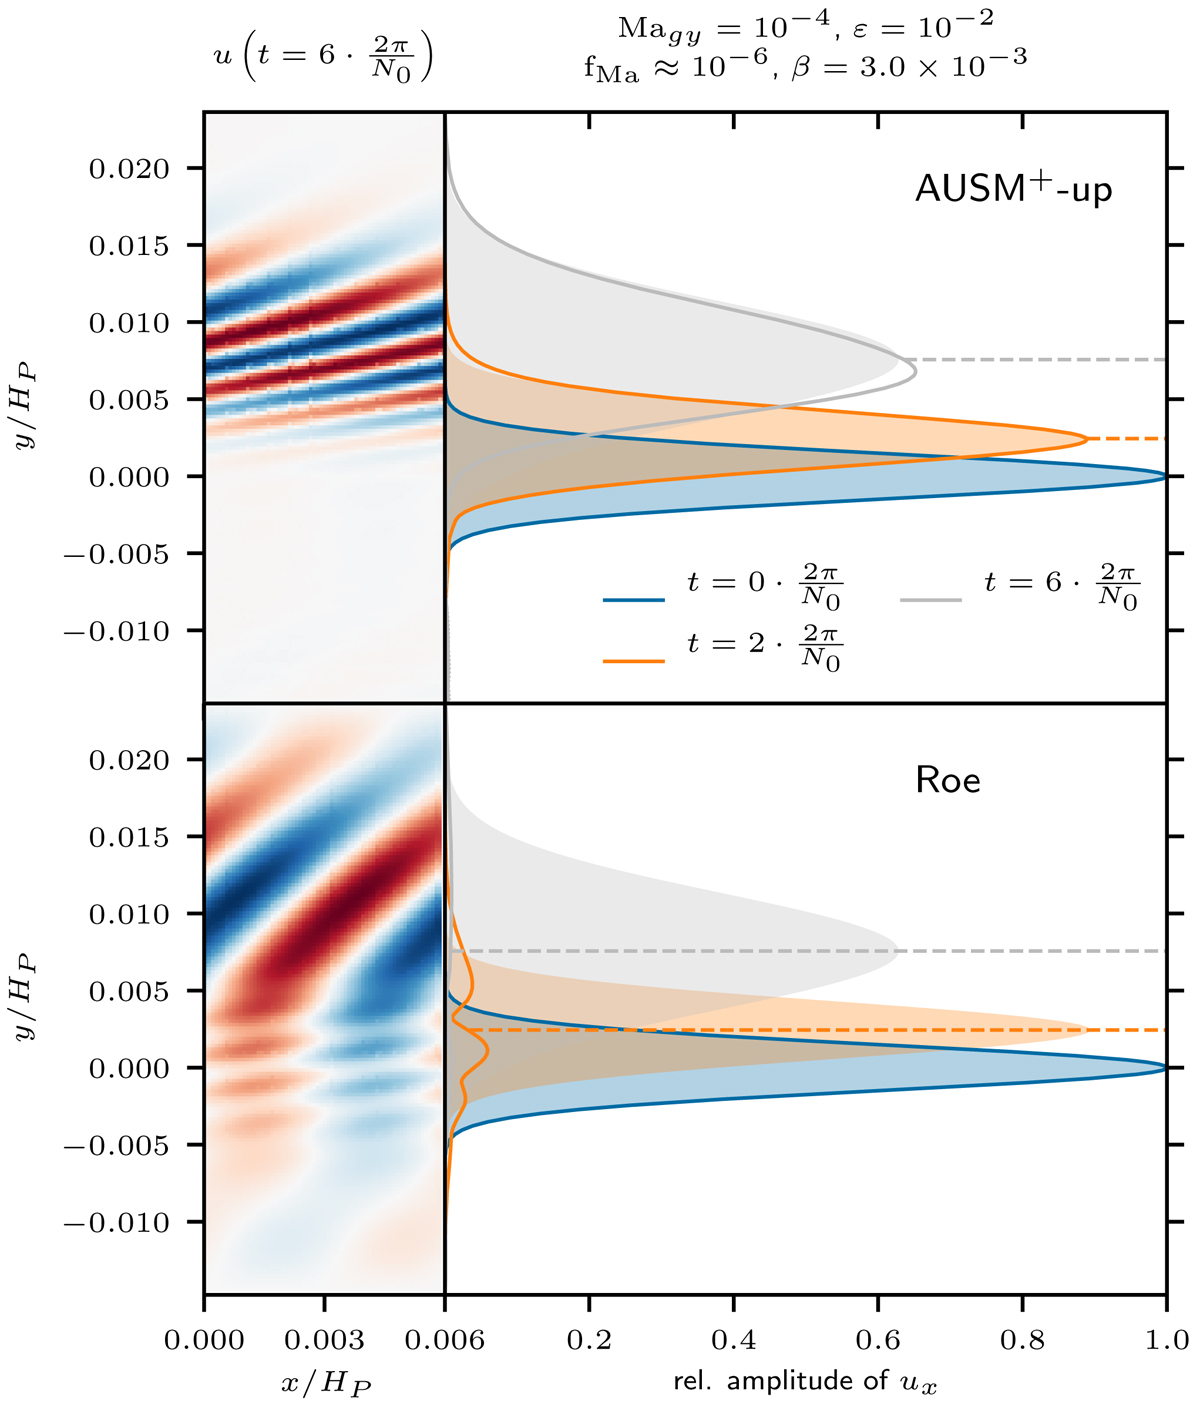
Results for the IGW test setup as described in Sect. 3 for the AUSM+-up solver (upper row) and the classical Roe solver (lower row). The parameters for the simulation are shown at the top of the plot and described in the main text. Left column: horizontal velocity u in the 2D domain at the end of the simulation at ![]() . Blue color corresponds to a positive value, and red color to a negative value of the velocity. The scale is adjusted to the maximum amplitude for each run. Right column: amplitude extracted according to Eq. (21) at the beginning of the simulation and at two later points in time (solid lines). The shaded areas correspond to the predicted shape of the amplitude modulation function according to Eqs. (24) and (A.28). Dashed horizontal lines mark the position of the peak amplitude for the prediction that moves at the group velocity accordingto Eq. (17).
. Blue color corresponds to a positive value, and red color to a negative value of the velocity. The scale is adjusted to the maximum amplitude for each run. Right column: amplitude extracted according to Eq. (21) at the beginning of the simulation and at two later points in time (solid lines). The shaded areas correspond to the predicted shape of the amplitude modulation function according to Eqs. (24) and (A.28). Dashed horizontal lines mark the position of the peak amplitude for the prediction that moves at the group velocity accordingto Eq. (17).
Current usage metrics show cumulative count of Article Views (full-text article views including HTML views, PDF and ePub downloads, according to the available data) and Abstracts Views on Vision4Press platform.
Data correspond to usage on the plateform after 2015. The current usage metrics is available 48-96 hours after online publication and is updated daily on week days.
Initial download of the metrics may take a while.