Free Access
Fig. A.1.
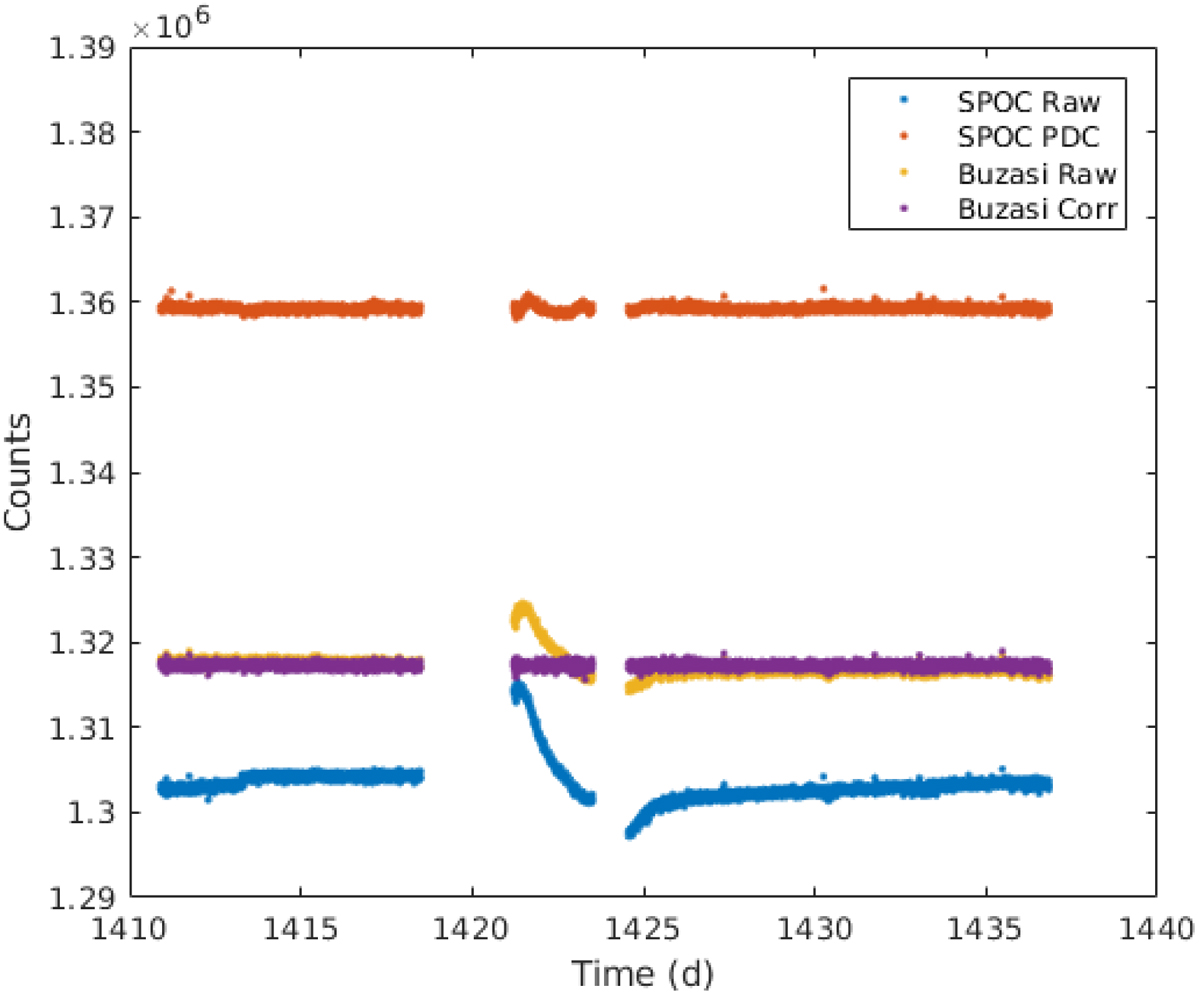
Resulting counts over time for different TESS data reduction pipelines. The Buzasi Corr time series very effectively removes most of the long-period variability; however, the SPOC time series still shows the lowest variance in the frequency range around the p-mode envelope.
Current usage metrics show cumulative count of Article Views (full-text article views including HTML views, PDF and ePub downloads, according to the available data) and Abstracts Views on Vision4Press platform.
Data correspond to usage on the plateform after 2015. The current usage metrics is available 48-96 hours after online publication and is updated daily on week days.
Initial download of the metrics may take a while.