Fig. 6.
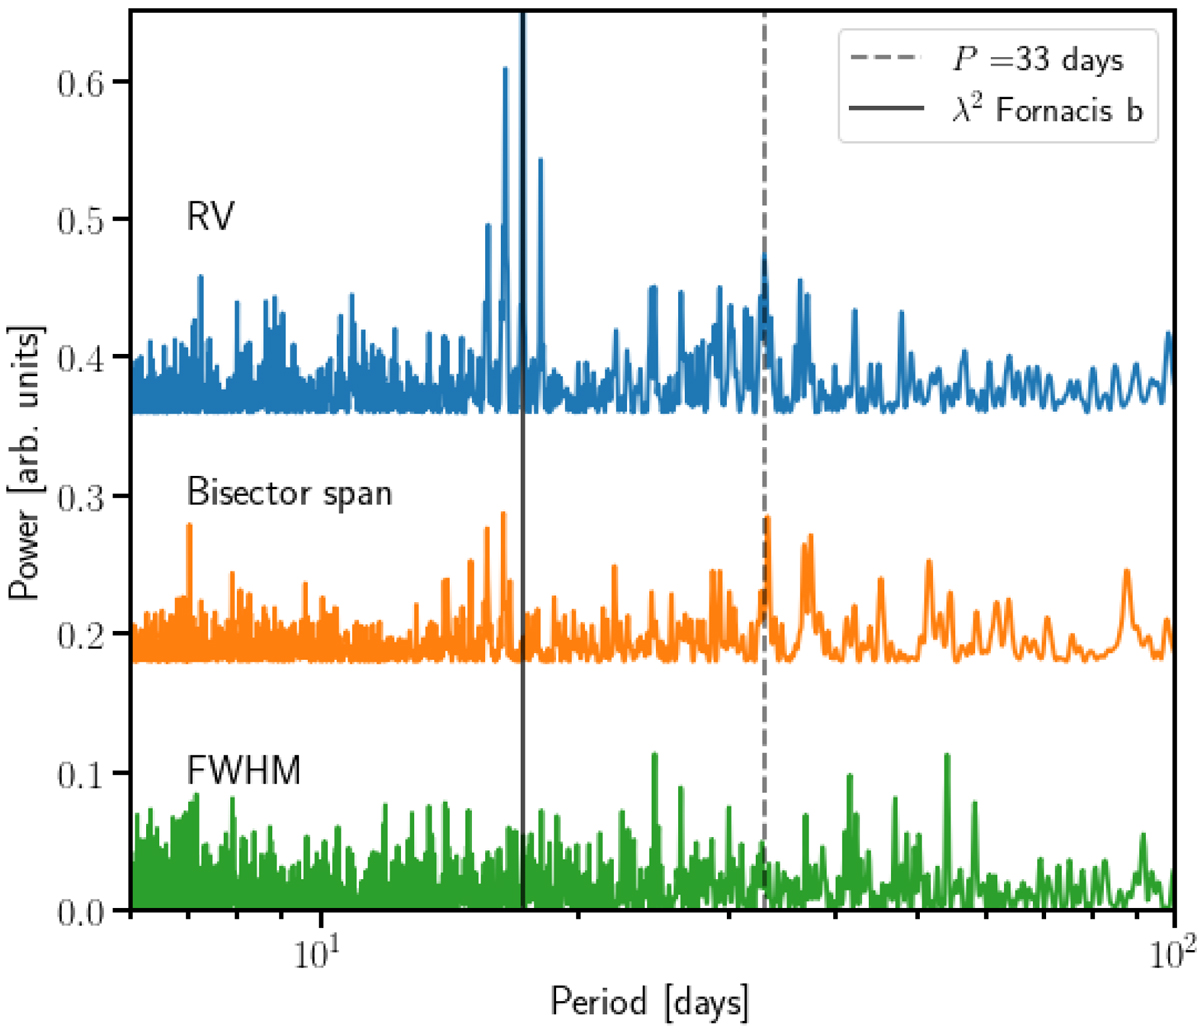
Periodograms of the HARPS RV data (blue), the spectral line bisector span (orange), and the cross-correlation function full-width at half maximum (FWHM, green). The FWHM and bisector span were only available for the HARPS data, and so the AAT and Keck data are not included in the power spectra shown here. The full vertical line shows the period of λ2 For b, and the dashed line is the secondary 33-day periodicity. The comb of peaks around the orbital period of λ2 For b are caused by the observational window function, as is the case for many of the peaks around the 33-day periodicity.
Current usage metrics show cumulative count of Article Views (full-text article views including HTML views, PDF and ePub downloads, according to the available data) and Abstracts Views on Vision4Press platform.
Data correspond to usage on the plateform after 2015. The current usage metrics is available 48-96 hours after online publication and is updated daily on week days.
Initial download of the metrics may take a while.