Fig. 5.
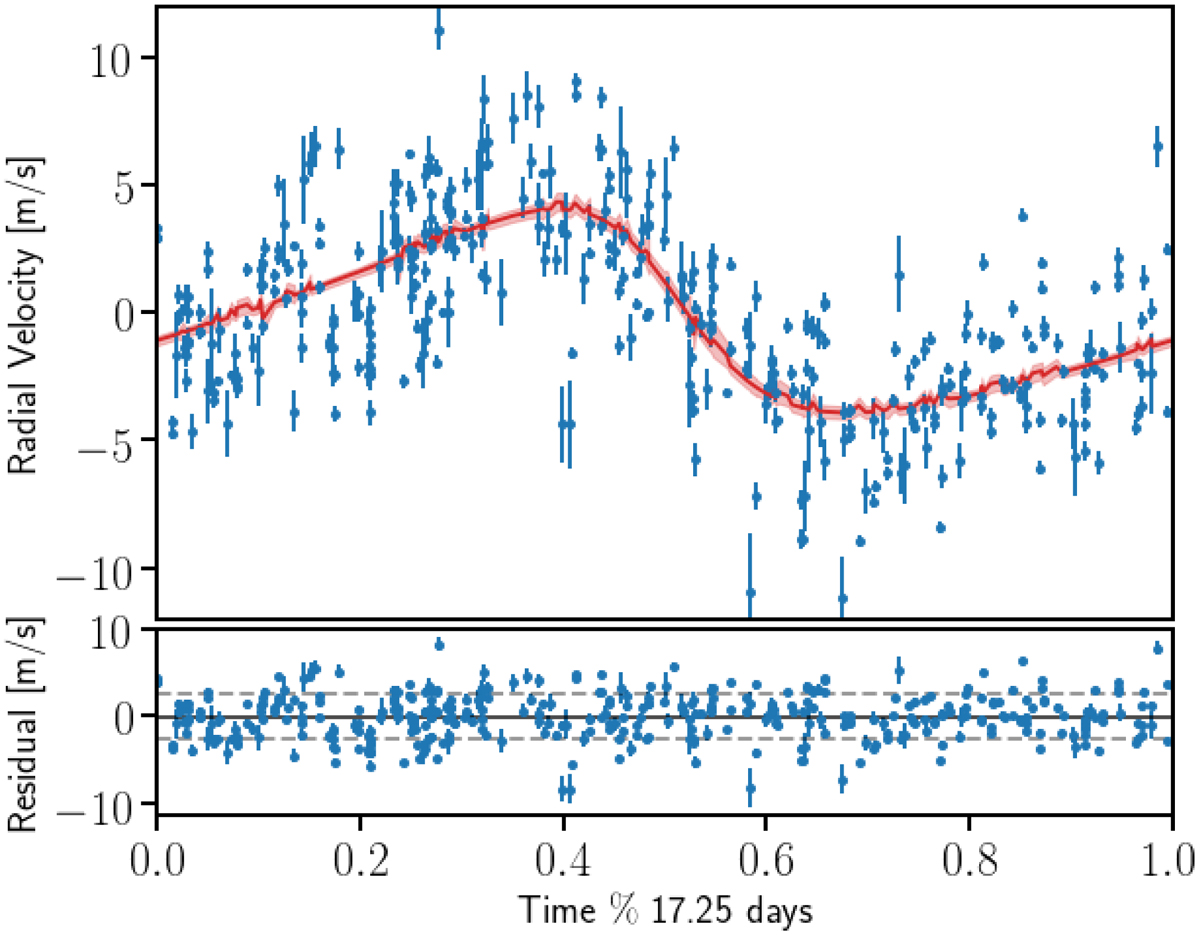
Top: observational RV data (blue) of λ2 For, from AAT, Keck, and HARPS, phase-folded at a period of 17.25 days. The phase-folded best-fit model is shown in red, with the model uncertainties in shaded red. Bottom: residual RV after subtracting the best-fit RV model. The dashed lines indicate the standard deviation, σ = 2.64 m s−1, of the residual.
Current usage metrics show cumulative count of Article Views (full-text article views including HTML views, PDF and ePub downloads, according to the available data) and Abstracts Views on Vision4Press platform.
Data correspond to usage on the plateform after 2015. The current usage metrics is available 48-96 hours after online publication and is updated daily on week days.
Initial download of the metrics may take a while.