Fig. 4.
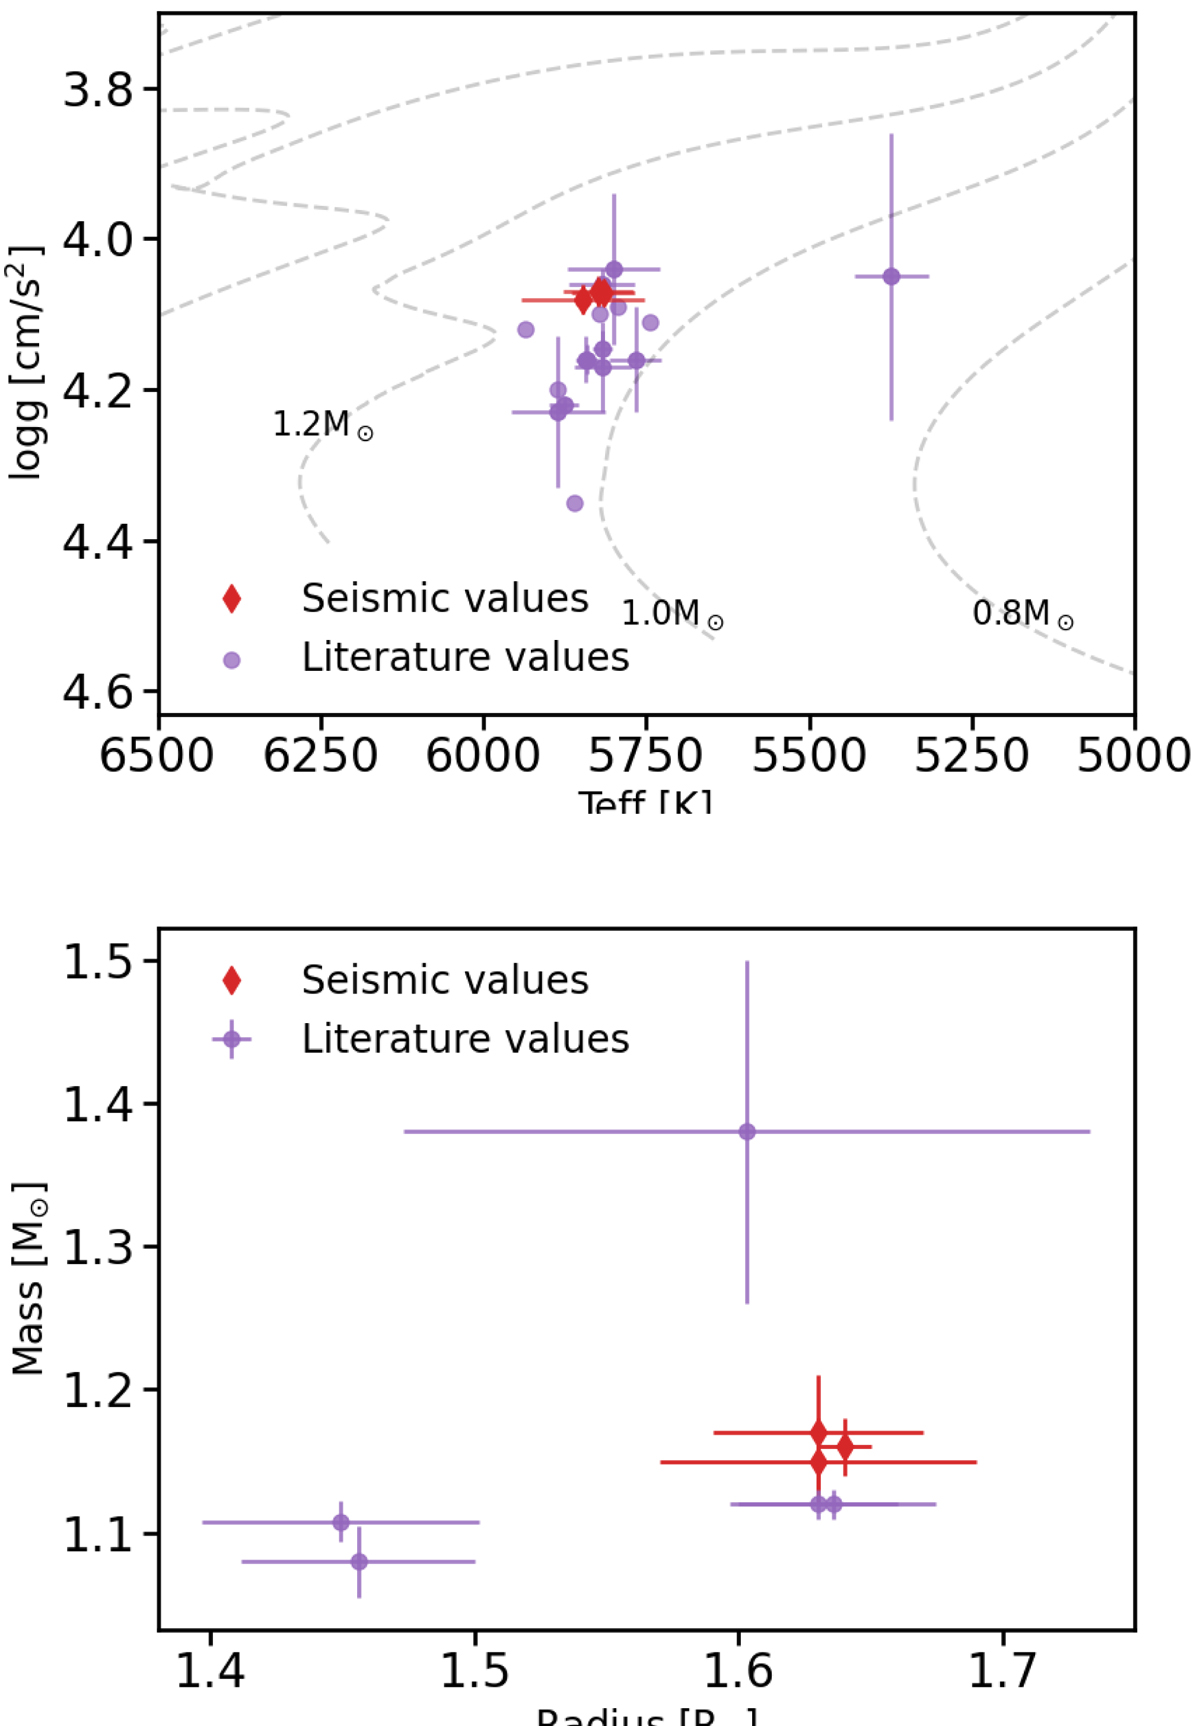
Top: Kiel diagram showing the literature values (purple) and seismic values (red; see Table 2) of λ2 For. Dashed lines indicate evolutionary tracks spanning a mass range of 0.8 − 2 M⊙, in increments of 0.2 M⊙. Literature values are presented in Table D.1. Bottom: masses and radii of the literature sources with a combination of log g with either mass or radius in comparison to the seismic estimates.
Current usage metrics show cumulative count of Article Views (full-text article views including HTML views, PDF and ePub downloads, according to the available data) and Abstracts Views on Vision4Press platform.
Data correspond to usage on the plateform after 2015. The current usage metrics is available 48-96 hours after online publication and is updated daily on week days.
Initial download of the metrics may take a while.