Fig. 2.
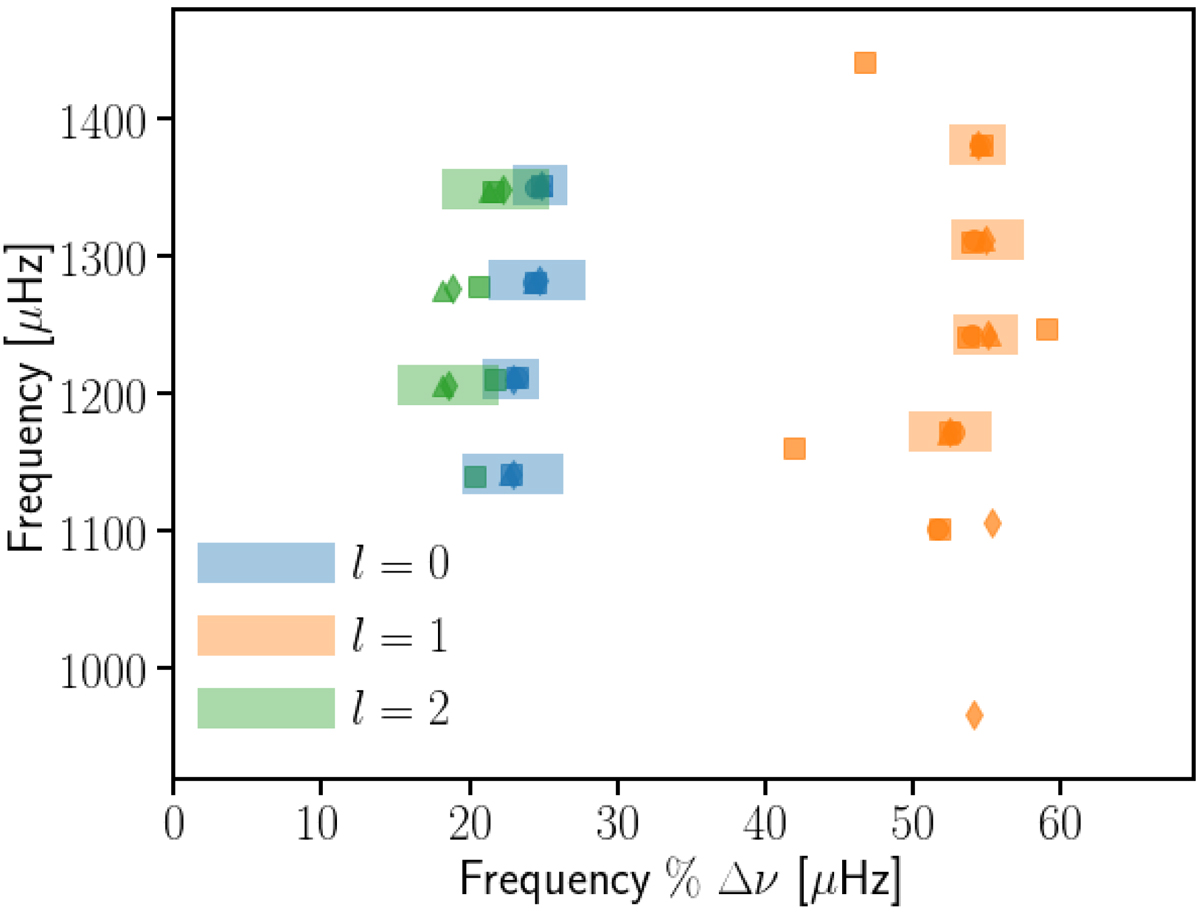
Échelle diagram showing oscillation frequencies modulo the large separation (Δν = 69.0 μHz) supplied by each team: MV (circles), IWR (squares), MBN (diamonds), and WJC (triangles). The colors represent the angular degrees, l, that were considered. The shaded regions represent 68% confidence interval of the frequencies in the final fit. Several mixed modes (diverging modes along the l = 1 ridge) were suggested, but could not be verified by the other teams, and so were not included in the final fit.
Current usage metrics show cumulative count of Article Views (full-text article views including HTML views, PDF and ePub downloads, according to the available data) and Abstracts Views on Vision4Press platform.
Data correspond to usage on the plateform after 2015. The current usage metrics is available 48-96 hours after online publication and is updated daily on week days.
Initial download of the metrics may take a while.