Free Access
Fig. 1.
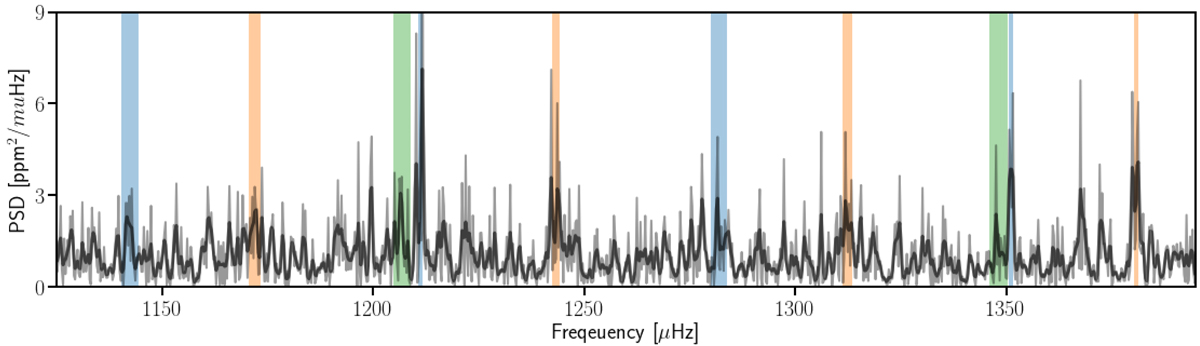
Power density spectrum (gray) and the smoothed spectrum (black) around the p-mode oscillation frequencies. The 68% confidence interval of the fit mode frequencies are shown as the vertical shaded regions. Colors denote the angular degree, l, where blue is l = 0, orange is l = 1, and green is l = 2.
Current usage metrics show cumulative count of Article Views (full-text article views including HTML views, PDF and ePub downloads, according to the available data) and Abstracts Views on Vision4Press platform.
Data correspond to usage on the plateform after 2015. The current usage metrics is available 48-96 hours after online publication and is updated daily on week days.
Initial download of the metrics may take a while.