Fig. 5
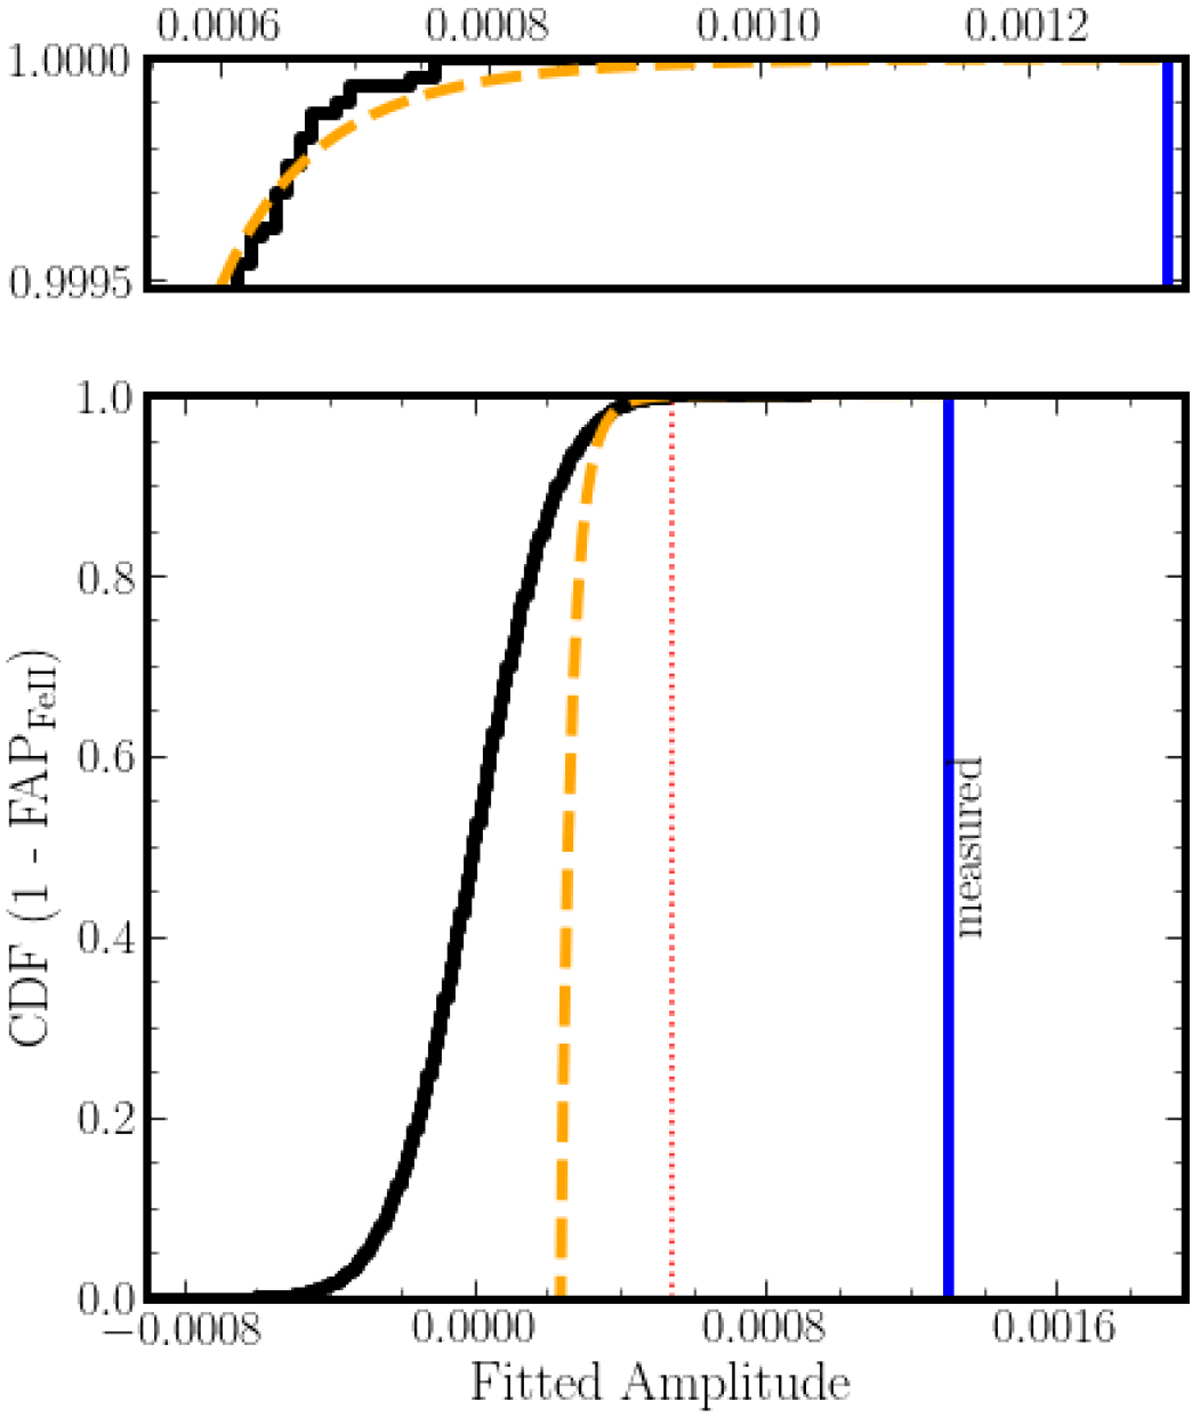
Cumulative distribution function of amplitudes of Gaussian fits to the randomly shuffled and stacked Fe II CCF. The black curve depicts the CDF. The solid blue line marks the strength of the Fe II detection. The dotted red line marks three standard deviations from the distribution mean, after which the distribution is fitted with a power law, shown as a the dashed orange line. The upper panel zooms in on the tail of the CDF for clarity.
Current usage metrics show cumulative count of Article Views (full-text article views including HTML views, PDF and ePub downloads, according to the available data) and Abstracts Views on Vision4Press platform.
Data correspond to usage on the plateform after 2015. The current usage metrics is available 48-96 hours after online publication and is updated daily on week days.
Initial download of the metrics may take a while.