Fig. 4
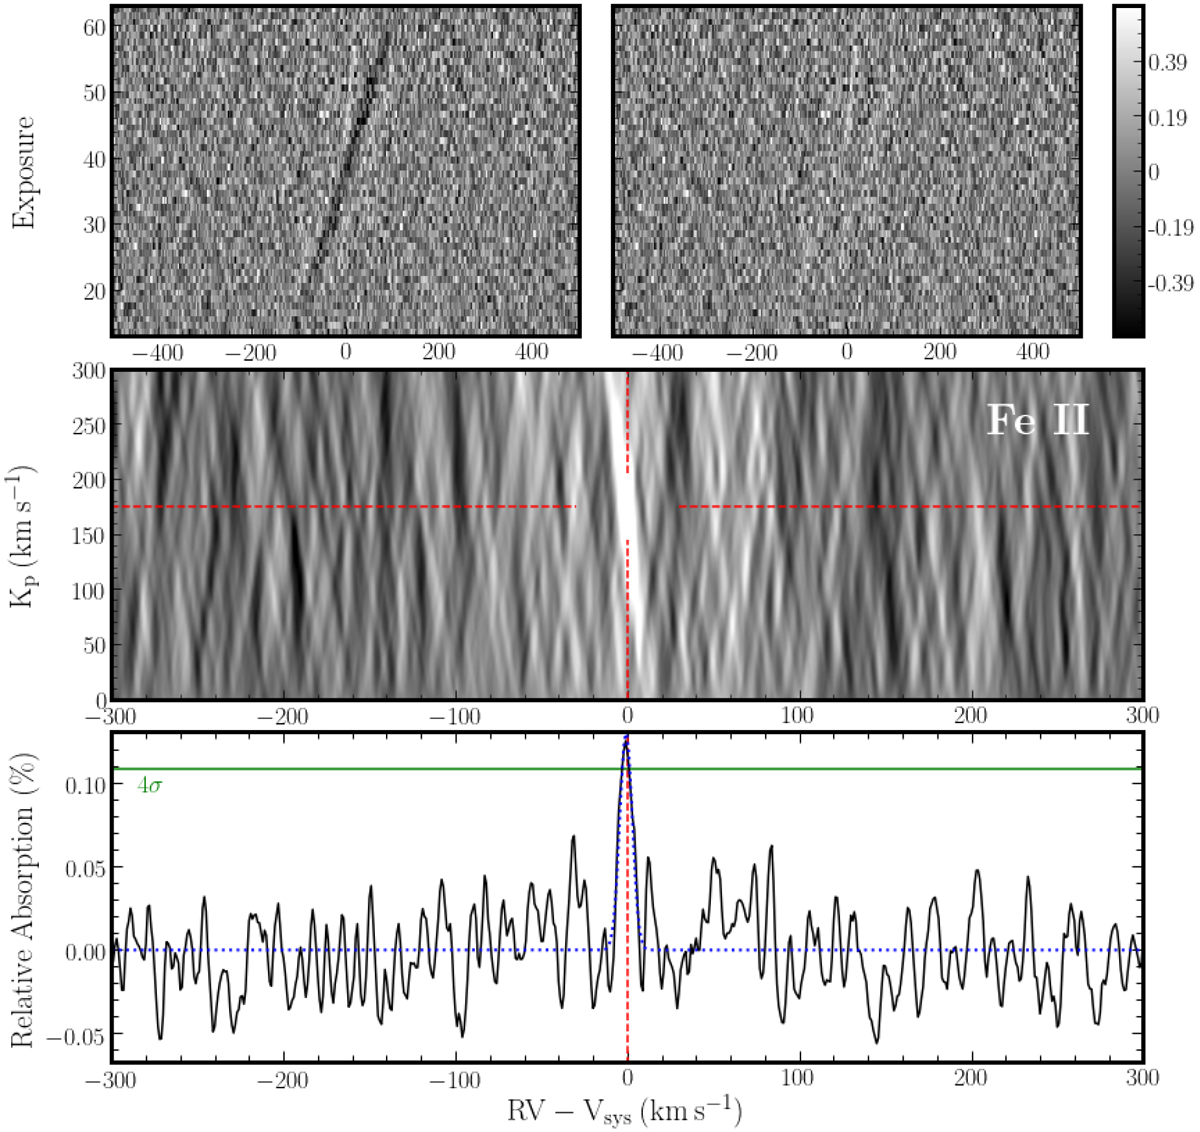
Cross-correlation procedure and detection of Fe II in the transmission spectrum of MASCARA-2 b. Upper panels: two-dimensional cross-correlation with the Fe II template before (left) and after (right) correction for the Doppler shadow. Middle panel: Kp Vsys diagram. The dashed red lines indicate the expected location of the atmospheric signal. Because the data are shifted by the systemic velocity and BERV, the signal lies at approximately 0 along the x-axis. Bottom panel: CCF coadded in the rest frame of the planet. The green line marks four times the standard deviation of the CCF. An enhancement is detected at the rest-frame velocity of the planet, which is modeled with a Gaussian profile (dotted blue line).
Current usage metrics show cumulative count of Article Views (full-text article views including HTML views, PDF and ePub downloads, according to the available data) and Abstracts Views on Vision4Press platform.
Data correspond to usage on the plateform after 2015. The current usage metrics is available 48-96 hours after online publication and is updated daily on week days.
Initial download of the metrics may take a while.