Fig. 1
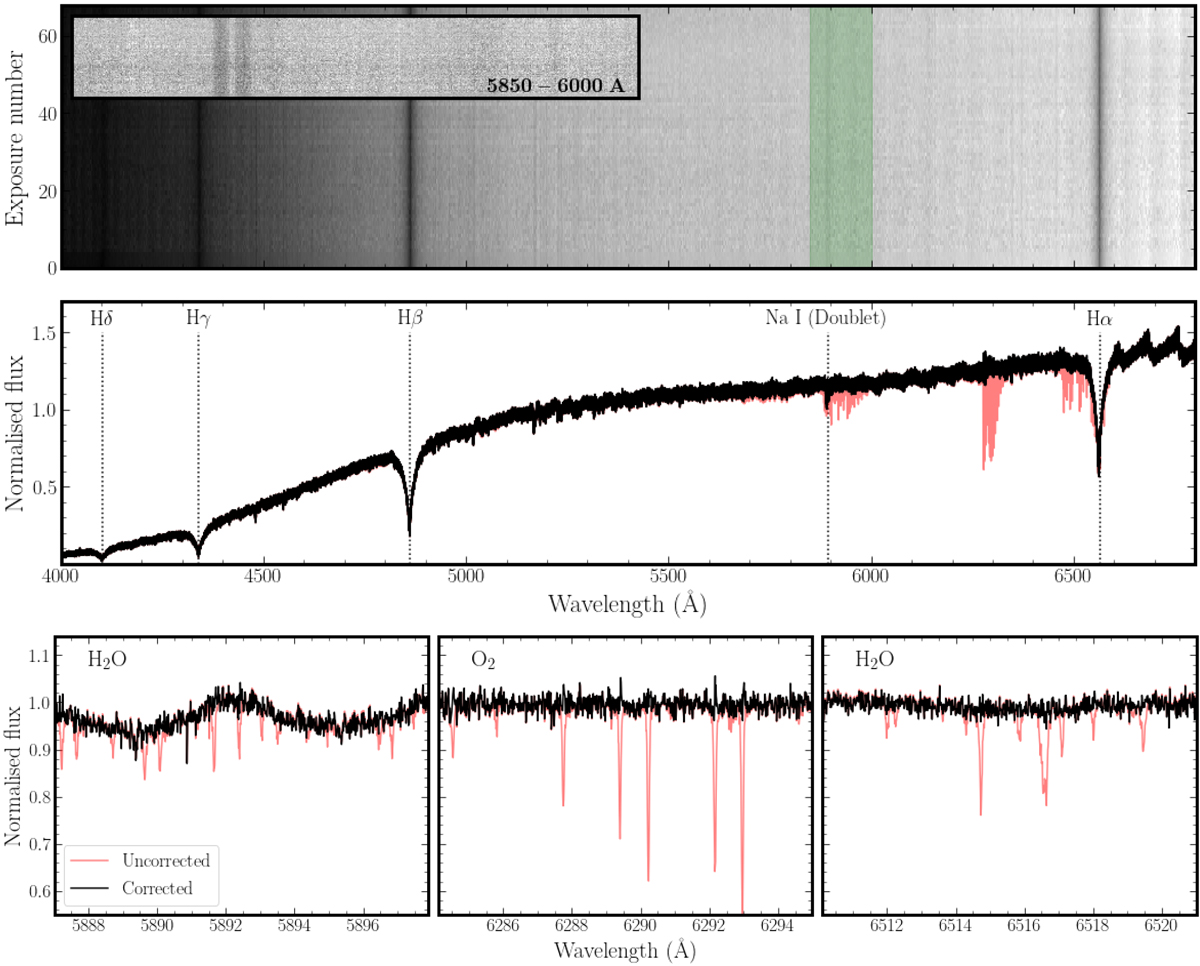
Spectra obtained on June 1, 2018, with EXPRES. Top panel: time-series, high-resolution spectra cleaned and corrected for tellurics. The orders are stitched together for visualization, but are analyzed independently during cross-correlation. Common features such as stellar lines appear as dark columns. Inset: zoom-in of the time-series spectra between 5850 and 6000 Å (marked by the green band), revealing the broadened Na doublet. Middle panel: example 1D spectrum from the time series before (red) and after (black) telluric correction. The features around 6700 Å are an artifact of order stitching. Some strong stellar lines, including the Balmer series and the sodium D lines, are marked. Bottom panels: zoom-in of the example 1D spectrum, demonstrating the effect of telluric correction in strongly contaminated regions (contaminated by H2O, O2, and H2O, from left to right).
Current usage metrics show cumulative count of Article Views (full-text article views including HTML views, PDF and ePub downloads, according to the available data) and Abstracts Views on Vision4Press platform.
Data correspond to usage on the plateform after 2015. The current usage metrics is available 48-96 hours after online publication and is updated daily on week days.
Initial download of the metrics may take a while.