Fig. 9
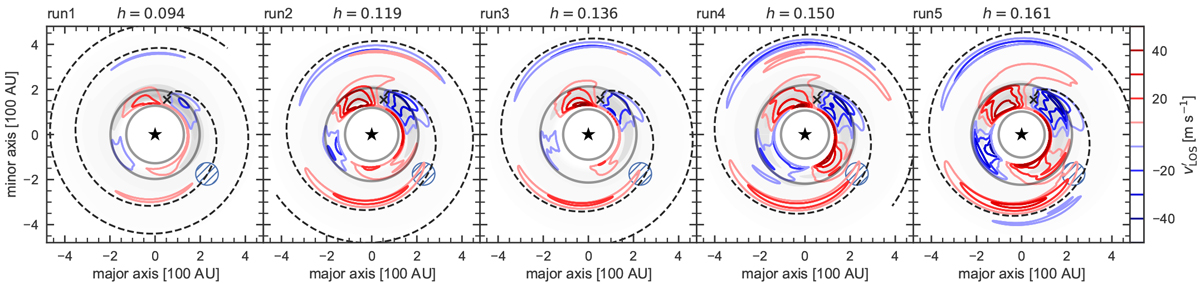
Comparative view of ![]() with varyingdisk temperature h. Disk orientation is taken consistent with values found in the literature on HD 142527 (i = 27 °
Fukagawa et al. 2013, PA = 71°
Kataoka et al. 2016). A mock-up of a spectral resolution of 12.5 m s−1
is shown. The reference setup occupies the leftmost panel. Velocities in the cavity are masked as in Fig. 8. In dashed lines, the best fit spirals following (Huang et al. 2019; Eq. (2) therein) are overplotted, based on linear perturbation theory (Goldreich & Tremaine 1979; Rafikov 2002; Muto et al. 2012). Those fits were computed using
vr = 0 contours as input data. As a visual indicator, surface density is underplotted in grayscale. Additionally, gray circles indicate the 3σj region around the vortex eye, which is used later in Fig. 10. As in other figures, the black cross indicates the density maximum.
with varyingdisk temperature h. Disk orientation is taken consistent with values found in the literature on HD 142527 (i = 27 °
Fukagawa et al. 2013, PA = 71°
Kataoka et al. 2016). A mock-up of a spectral resolution of 12.5 m s−1
is shown. The reference setup occupies the leftmost panel. Velocities in the cavity are masked as in Fig. 8. In dashed lines, the best fit spirals following (Huang et al. 2019; Eq. (2) therein) are overplotted, based on linear perturbation theory (Goldreich & Tremaine 1979; Rafikov 2002; Muto et al. 2012). Those fits were computed using
vr = 0 contours as input data. As a visual indicator, surface density is underplotted in grayscale. Additionally, gray circles indicate the 3σj region around the vortex eye, which is used later in Fig. 10. As in other figures, the black cross indicates the density maximum.
Current usage metrics show cumulative count of Article Views (full-text article views including HTML views, PDF and ePub downloads, according to the available data) and Abstracts Views on Vision4Press platform.
Data correspond to usage on the plateform after 2015. The current usage metrics is available 48-96 hours after online publication and is updated daily on week days.
Initial download of the metrics may take a while.