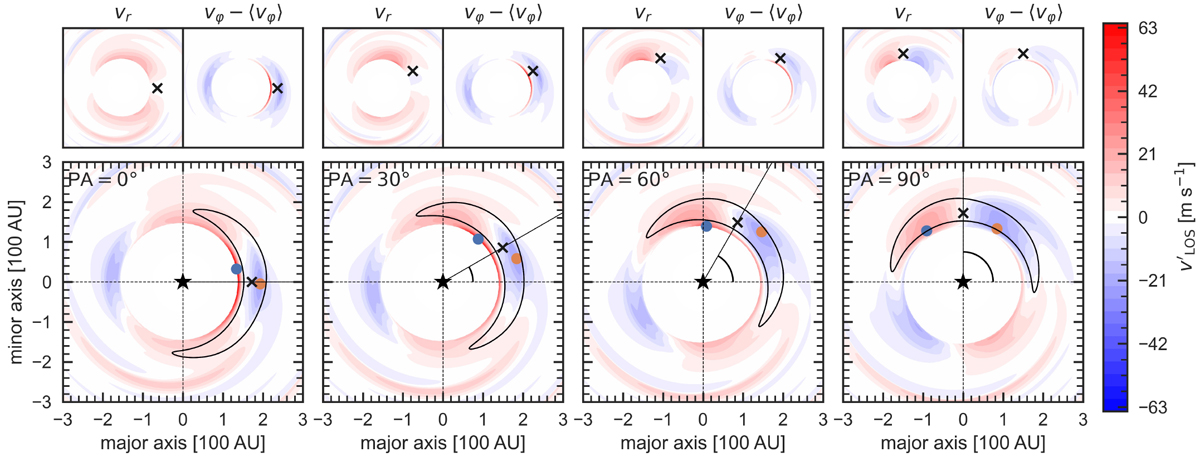
Fig. 8

Line-of-sight velocities (bottom large panels) as defined in Eq. (10), applied to HD 142527 with i = 27 °, and varying PA. Top panels: exhibit the corresponding polar components. Color reflects implied Doppler-shifts in molecular lines. Blue/orange dots indicate extreme values in
![]() .
Leftmost panel: vortex’s spatial extension is shown as a solid contour which corresponds to Σ = 0.5Σ0, where Σ0 is the scaling factor used in Eq. (3). The inner cavity, where fast spiral waves are launched but surface density is low, is not shown here : regions with Σ∕Σ0 < 0.1 are masked. As a proxy for the vortex’s eye, a black cross indicates the density maximum.
.
Leftmost panel: vortex’s spatial extension is shown as a solid contour which corresponds to Σ = 0.5Σ0, where Σ0 is the scaling factor used in Eq. (3). The inner cavity, where fast spiral waves are launched but surface density is low, is not shown here : regions with Σ∕Σ0 < 0.1 are masked. As a proxy for the vortex’s eye, a black cross indicates the density maximum.
Current usage metrics show cumulative count of Article Views (full-text article views including HTML views, PDF and ePub downloads, according to the available data) and Abstracts Views on Vision4Press platform.
Data correspond to usage on the plateform after 2015. The current usage metrics is available 48-96 hours after online publication and is updated daily on week days.
Initial download of the metrics may take a while.


