Fig. 6
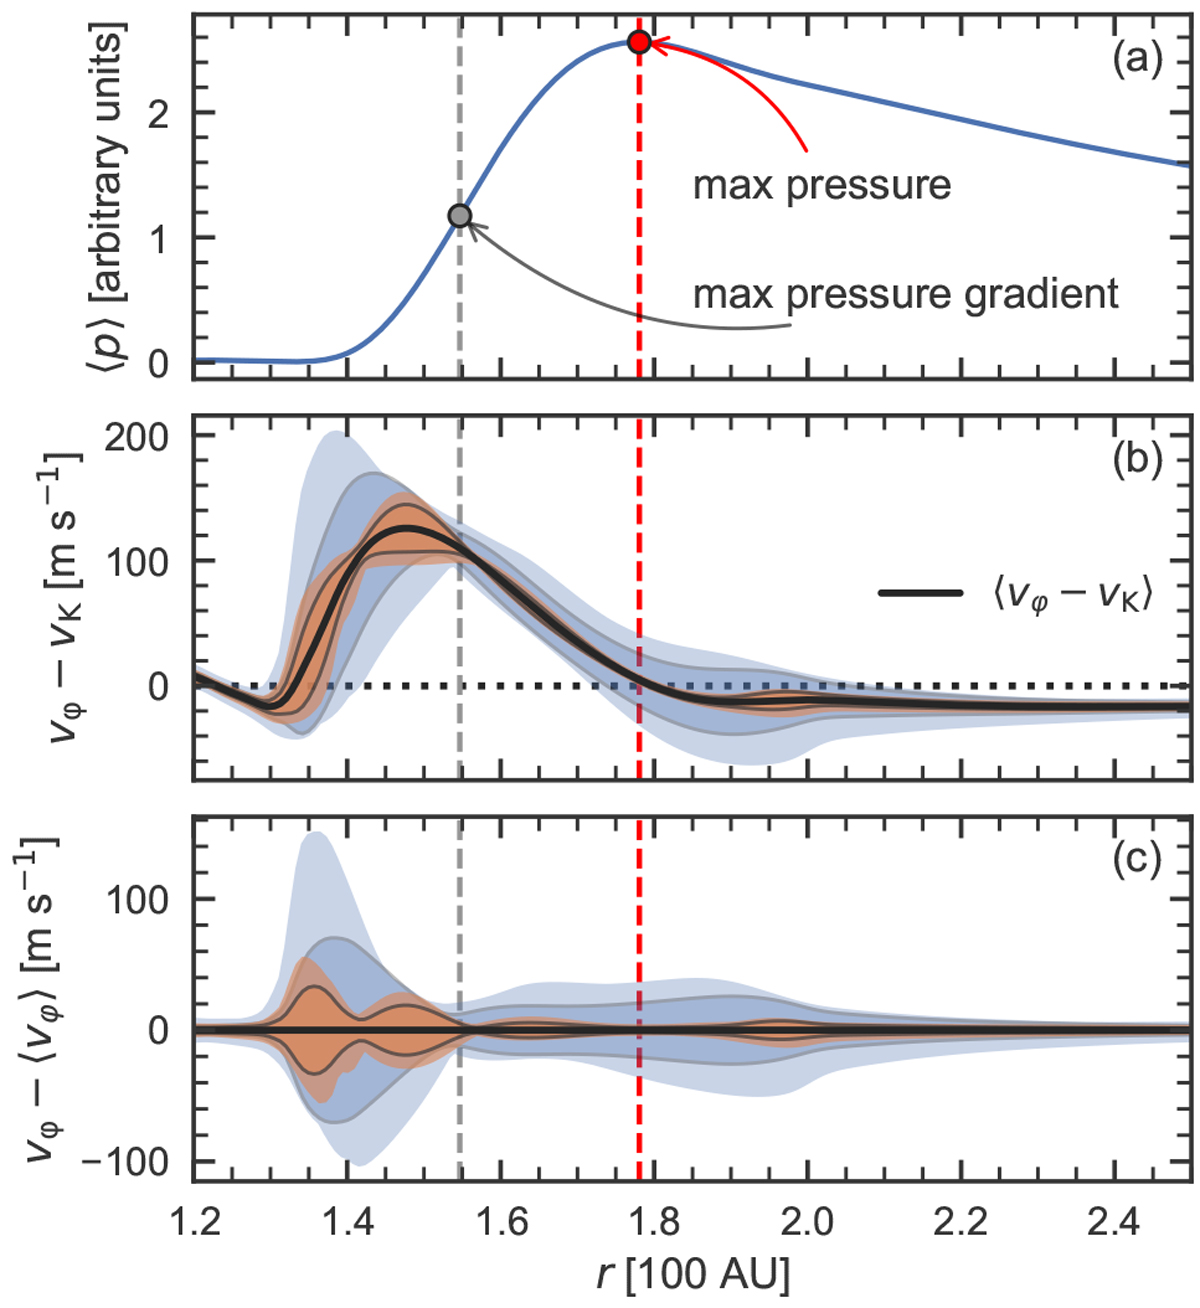
Comparison between Keplerian velocity vK and average azimuthal velocity ⟨vφ⟩ as 1D masks.(a) Pressure profile in arbitrary units. (b and c) Azimuthal velocity cross-sections, with offsets (masks) vK and ⟨vφ ⟩, respectively. The average ⟨V −mask⟩ is indicated by a thick black line, while shadows show the amplitude and standard deviations in blue (V = vφ), and orange (![]() ). Data are taken at t = 200 orbital periods (inspiration for this figure was drawn from Teague et al. 2018a).
). Data are taken at t = 200 orbital periods (inspiration for this figure was drawn from Teague et al. 2018a).
Current usage metrics show cumulative count of Article Views (full-text article views including HTML views, PDF and ePub downloads, according to the available data) and Abstracts Views on Vision4Press platform.
Data correspond to usage on the plateform after 2015. The current usage metrics is available 48-96 hours after online publication and is updated daily on week days.
Initial download of the metrics may take a while.