Fig. 4
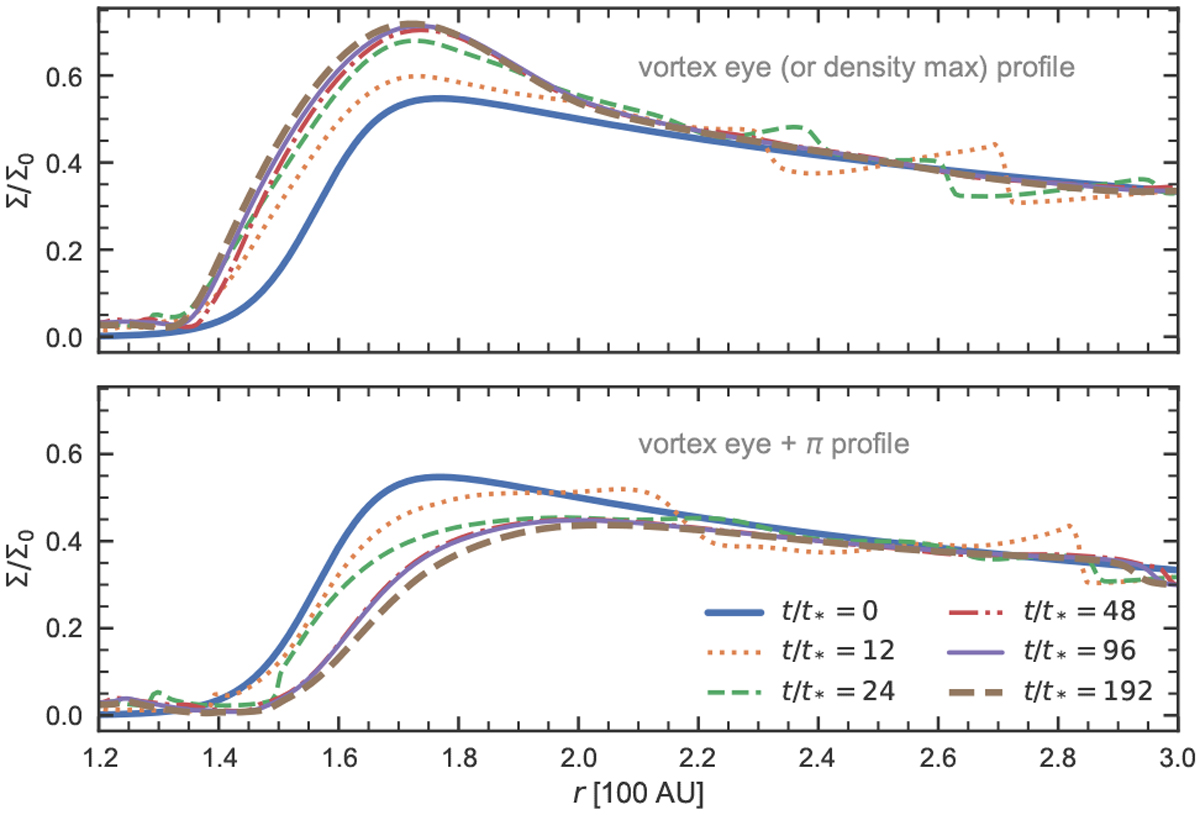
Time evolution of the radial density profile, plotted as slices at the azimuth of the density maximum where the vortex eye lies (top) and its radial opposite (bottom). The slices correspond to the y = 0 axis in Fig. 3, with x > 0 (top) and x < 0 (bottom), respectively. After ~40 orbital periods, the disk has practically reached a stationary state. The cavity profile itself has become uneven, showing a non-zero eccentricity.
Current usage metrics show cumulative count of Article Views (full-text article views including HTML views, PDF and ePub downloads, according to the available data) and Abstracts Views on Vision4Press platform.
Data correspond to usage on the plateform after 2015. The current usage metrics is available 48-96 hours after online publication and is updated daily on week days.
Initial download of the metrics may take a while.