Fig. 3
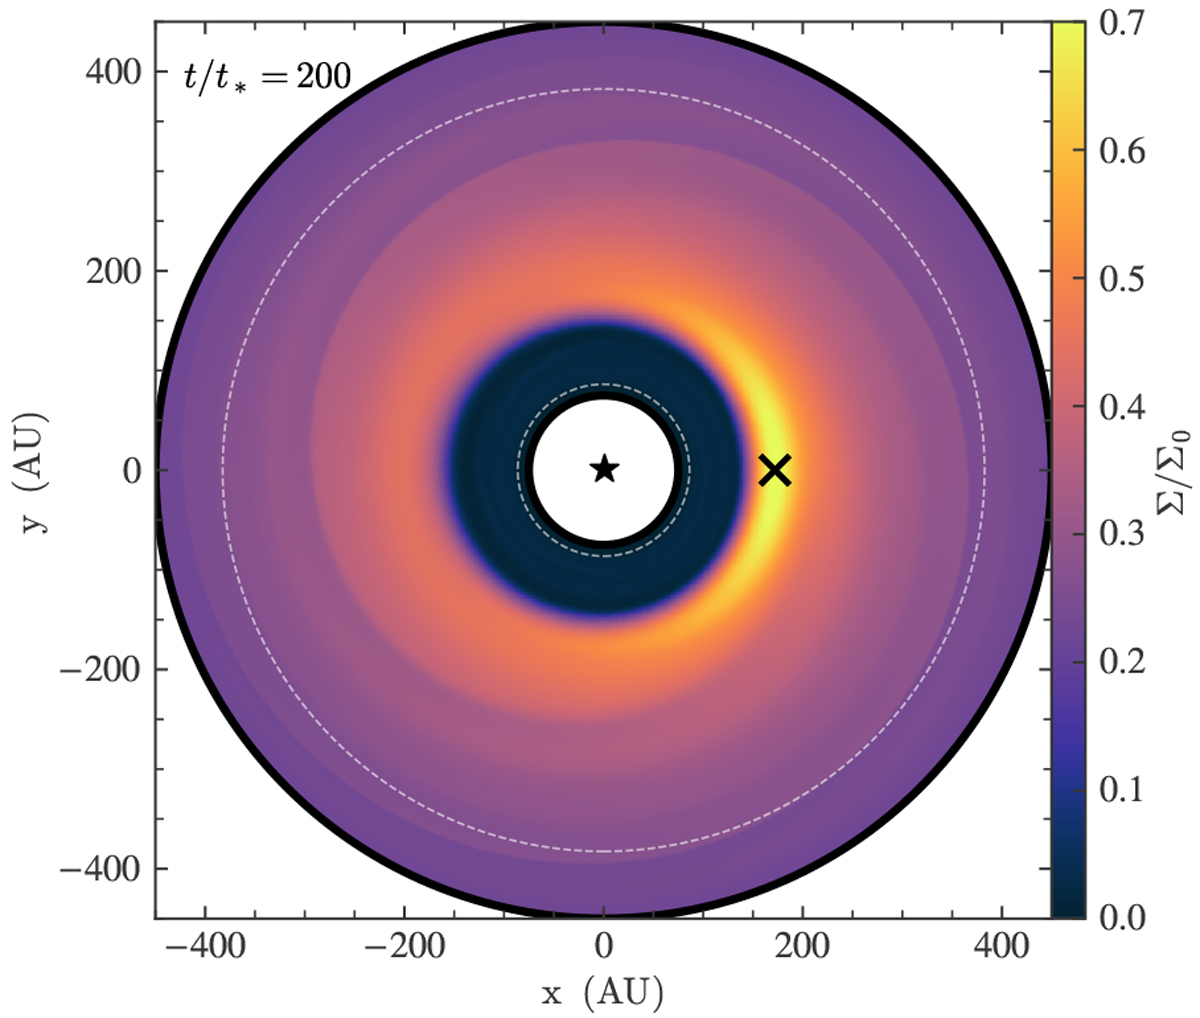
Gas surface density plotted in Cartesian coordinates (x, y) after t = 200 orbital periods (t*). The globaldensity maximum is indicated by a black cross. The position of the central star is denoted as a “⋆” symbol. Thesimulation box radial limits are drawn as solid black circles, while the dashed-line circles indicate the limits of wave damping zones.
Current usage metrics show cumulative count of Article Views (full-text article views including HTML views, PDF and ePub downloads, according to the available data) and Abstracts Views on Vision4Press platform.
Data correspond to usage on the plateform after 2015. The current usage metrics is available 48-96 hours after online publication and is updated daily on week days.
Initial download of the metrics may take a while.