Fig. B.1
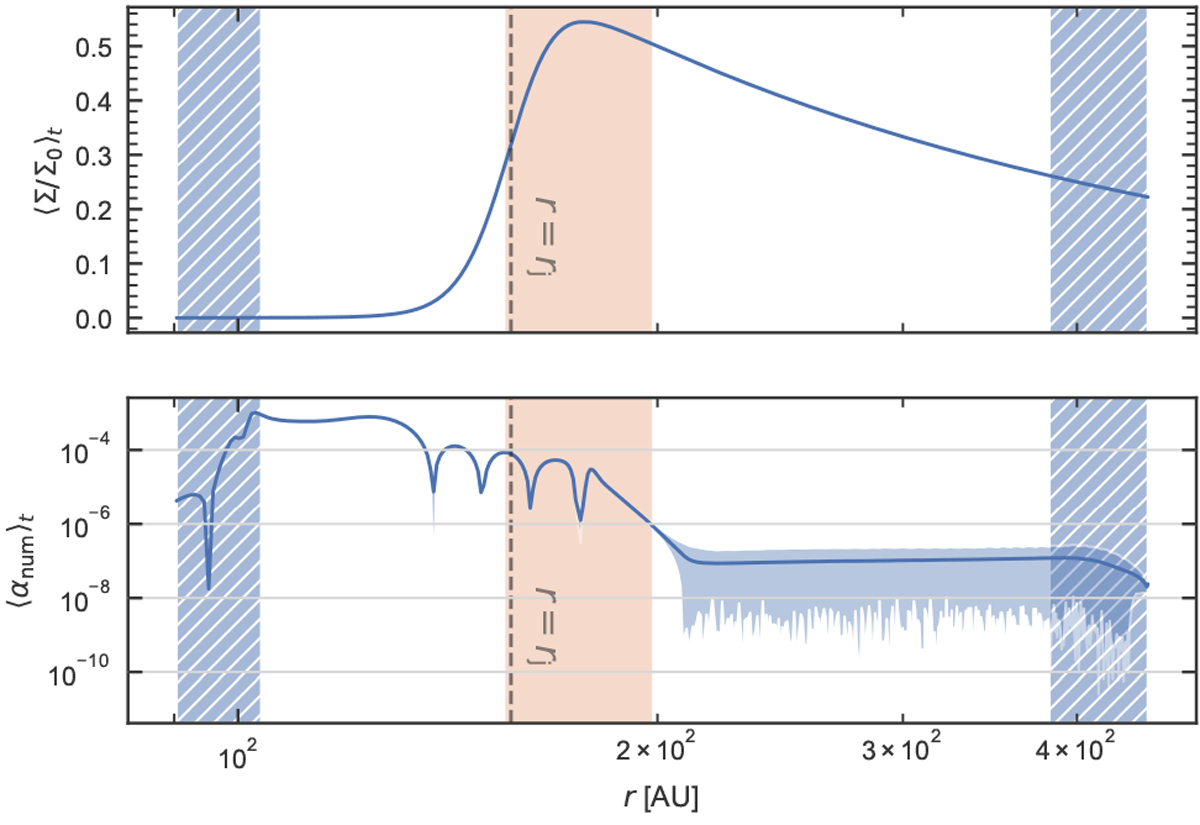
Density (top) and numerical viscosity equivalent α value (bottom) time-averaged over 10 orbital periods (t∕t*∈ [90, 100]) with a sampling rate of 0.1 orbital periods. The solid blue shadows indicate the variation interval over the sample time series, showing that the profile is very stable in the region of interest. The hatched regions highlight the wave-killing zones, while the orange region loosely indicates the vortex-forming region, spanning one scale height away from the local density maximum.
Current usage metrics show cumulative count of Article Views (full-text article views including HTML views, PDF and ePub downloads, according to the available data) and Abstracts Views on Vision4Press platform.
Data correspond to usage on the plateform after 2015. The current usage metrics is available 48-96 hours after online publication and is updated daily on week days.
Initial download of the metrics may take a while.