Fig. 15
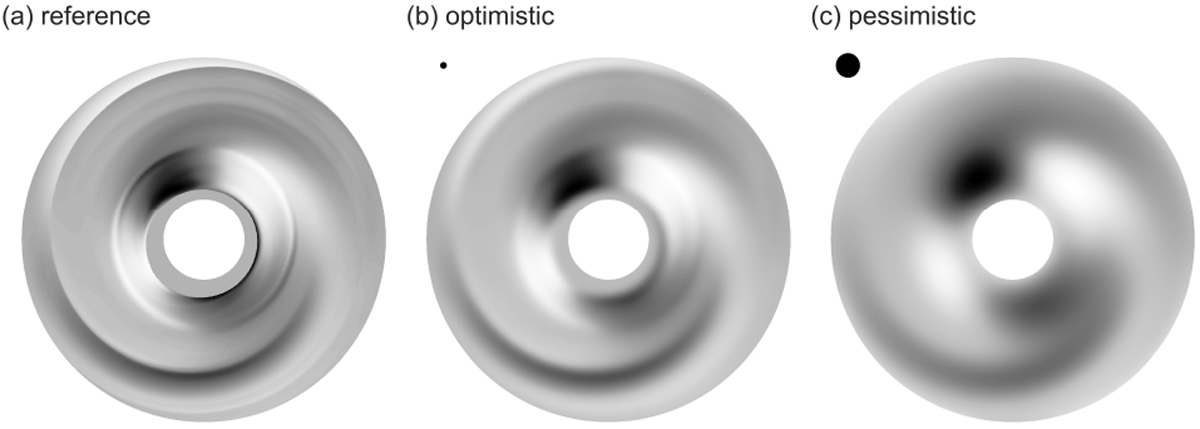
Qualitative comparison between a simulation-precision velocity map (left), and against artificially lowered spatial resolution, simulation with a Gaussian kernel convolution. Kernels with angular size (in proportions of the target) 7% (center), and a 3 times larger one 21% (right) are shown. With the distance of HD 142527, the center panel corresponds to the recent high resolution obtained by Keppler et al. (2019). No noise is added. Projected velocities are shown in linear gray-scale, where
![]() is shown in light gray and
is shown in light gray and ![]() shown in is dark gray. Secondary spiral patterns are lost at low resolution but the primary remains visible. Beam size is shown as a black dot. The velocity map corresponds to the rightmost panel in Fig. 9.
shown in is dark gray. Secondary spiral patterns are lost at low resolution but the primary remains visible. Beam size is shown as a black dot. The velocity map corresponds to the rightmost panel in Fig. 9.
Current usage metrics show cumulative count of Article Views (full-text article views including HTML views, PDF and ePub downloads, according to the available data) and Abstracts Views on Vision4Press platform.
Data correspond to usage on the plateform after 2015. The current usage metrics is available 48-96 hours after online publication and is updated daily on week days.
Initial download of the metrics may take a while.