Fig. 11
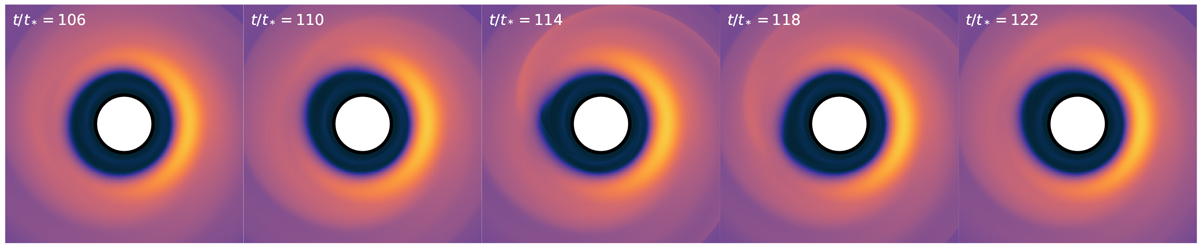
Formation/dissipation cycle of a secondary spiral arm connected with disk eccentricity, illustrated for the most prominent case, run 5. Color maps density (same scale as Fig. 3). This secondary spiral is a transient and periodic phenomenon, which is responsible for large oscillations in maximum projected velocity as measured in Fig. 10
Current usage metrics show cumulative count of Article Views (full-text article views including HTML views, PDF and ePub downloads, according to the available data) and Abstracts Views on Vision4Press platform.
Data correspond to usage on the plateform after 2015. The current usage metrics is available 48-96 hours after online publication and is updated daily on week days.
Initial download of the metrics may take a while.