Fig. 10
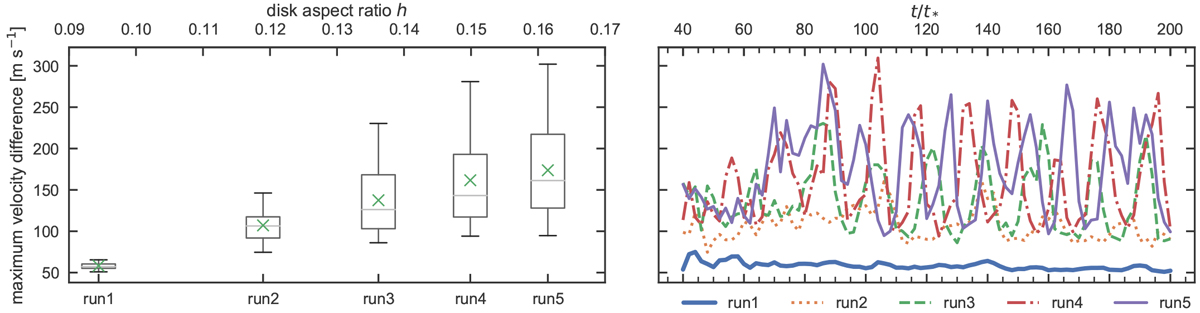
Amplitude in ![]() across the annular region shown in Fig. 9, throughout the simulation time, represented as a boxplot (left). The whole time series is unraveled in the right panel. It is sampled every 2 orbital periods (the output rate of our simulations). Although the first run is remarkably constant, runs 3 to 5 exhibit significant dispersion within this metric, while the mean value (green crosses) itself is stabilized. The period of these oscillations corresponds to the life cycle of a secondary spiral arm, illustrated in Fig. 11.
across the annular region shown in Fig. 9, throughout the simulation time, represented as a boxplot (left). The whole time series is unraveled in the right panel. It is sampled every 2 orbital periods (the output rate of our simulations). Although the first run is remarkably constant, runs 3 to 5 exhibit significant dispersion within this metric, while the mean value (green crosses) itself is stabilized. The period of these oscillations corresponds to the life cycle of a secondary spiral arm, illustrated in Fig. 11.
Current usage metrics show cumulative count of Article Views (full-text article views including HTML views, PDF and ePub downloads, according to the available data) and Abstracts Views on Vision4Press platform.
Data correspond to usage on the plateform after 2015. The current usage metrics is available 48-96 hours after online publication and is updated daily on week days.
Initial download of the metrics may take a while.