Free Access
Fig. B.6
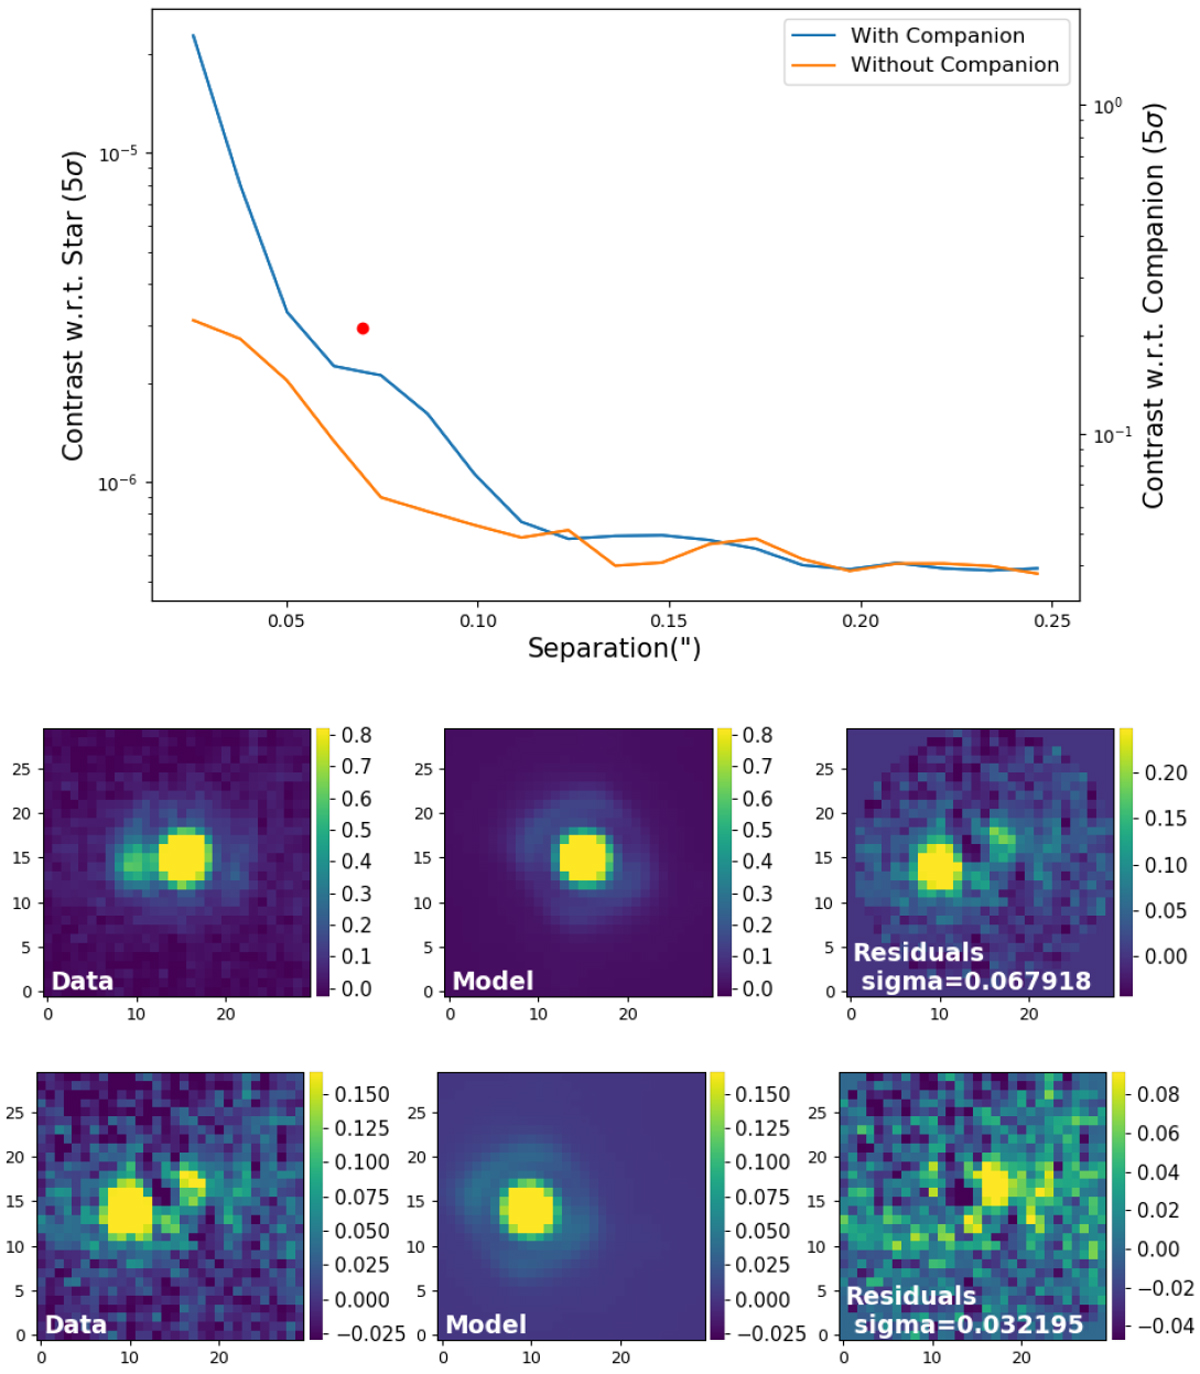
Contrast curve (upper figure) with and without the P2 point source (S2 was removed before calculating the contrasts and is represented by the red dot) and images of the object P2 (lower figures) around HIP 87836, model and residuals of, from the top, the primary P2, and the secondary S2.
Current usage metrics show cumulative count of Article Views (full-text article views including HTML views, PDF and ePub downloads, according to the available data) and Abstracts Views on Vision4Press platform.
Data correspond to usage on the plateform after 2015. The current usage metrics is available 48-96 hours after online publication and is updated daily on week days.
Initial download of the metrics may take a while.