Fig. 10
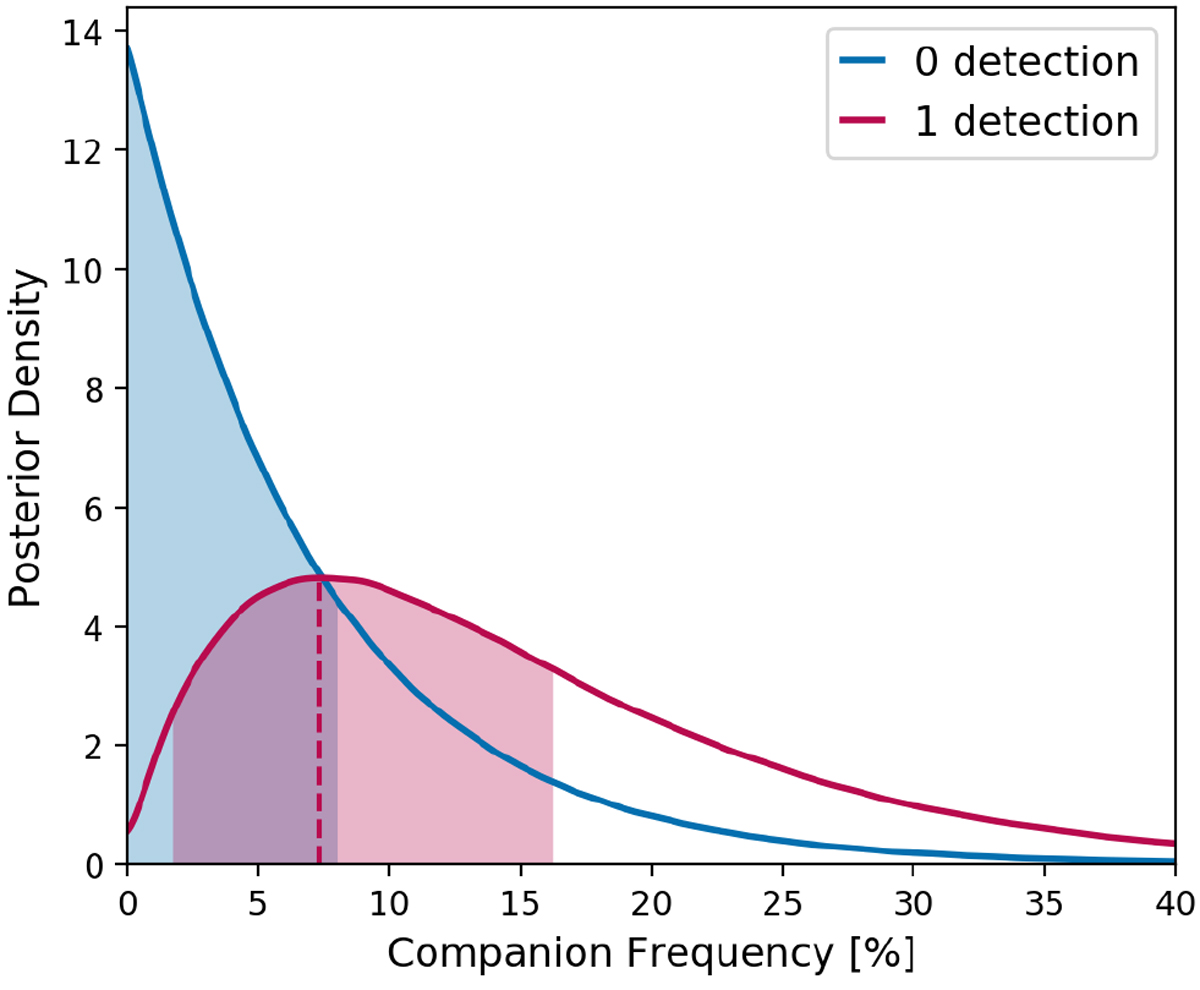
Posterior distributions obtained for the frequency of bound binary companions from the MCMC analysis, in cases of 0 (blue) and 1 (red) detection in our survey. Frequencies were derived over separation ranges of 0.5−100 au and mass ratios of q = 0.05−1. The red dashed line shows the peak of the posterior density in the 1-detection scenario, at 7.3%, while only an upper limit was obtained in the 0-detection case. The shaded areas correspond to the 68% confidence intervals.
Current usage metrics show cumulative count of Article Views (full-text article views including HTML views, PDF and ePub downloads, according to the available data) and Abstracts Views on Vision4Press platform.
Data correspond to usage on the plateform after 2015. The current usage metrics is available 48-96 hours after online publication and is updated daily on week days.
Initial download of the metrics may take a while.